Between balancing various stakeholder expectations and delivering high-quality products on time, measuring team performance is complex work. But if you don't understand what success looks like, you can't direct your team to achieve it.
There are countless moving parts to consider when measuring performance across large-scale projects. Multiple employees, vendors, and external stakeholders compete for your time and attention, and while tasks and processes carry out, it's your job to ensure nothing slips through the cracks.
Holding meetings and collecting status updates is often impractical and time-consuming — these methods take employees away from their duties and add more obligations to already busy schedules. By using an automated system to provide real-time performance updates, you can cut out extraneous meeting time and administrative tasks for improved efficiency.
That’s why project managers rely on key performance indicator (KPI) dashboards, which offer a consolidated view of all success metrics. Using a KPI dashboard, you can quickly identify trends, determine how to allocate resources, and make better decisions about your project’s next steps.
What’s a KPI dashboard?
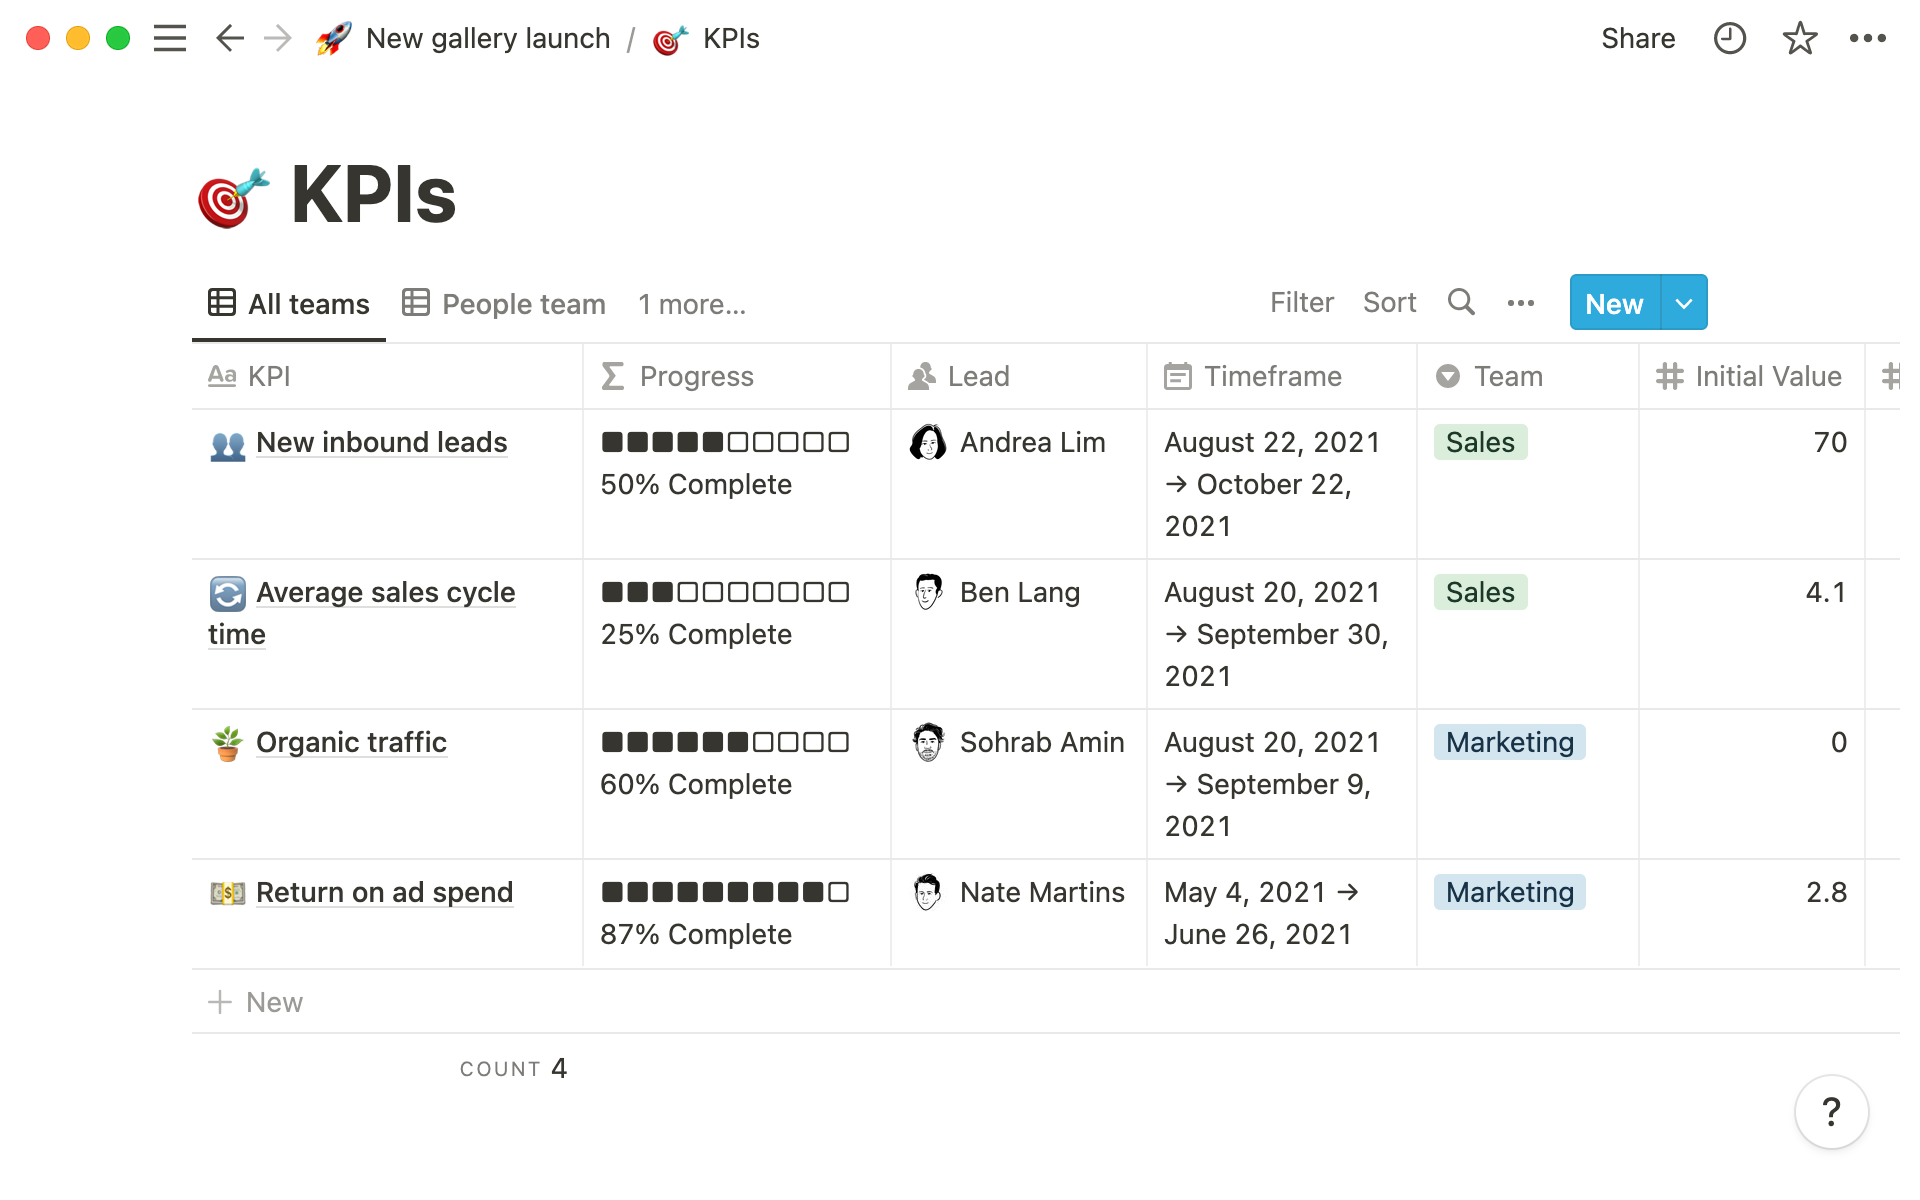
A KPI dashboard is a tool that visually displays performance indicators, organizing metrics into a chart or graph best suited for representing the relevant data.
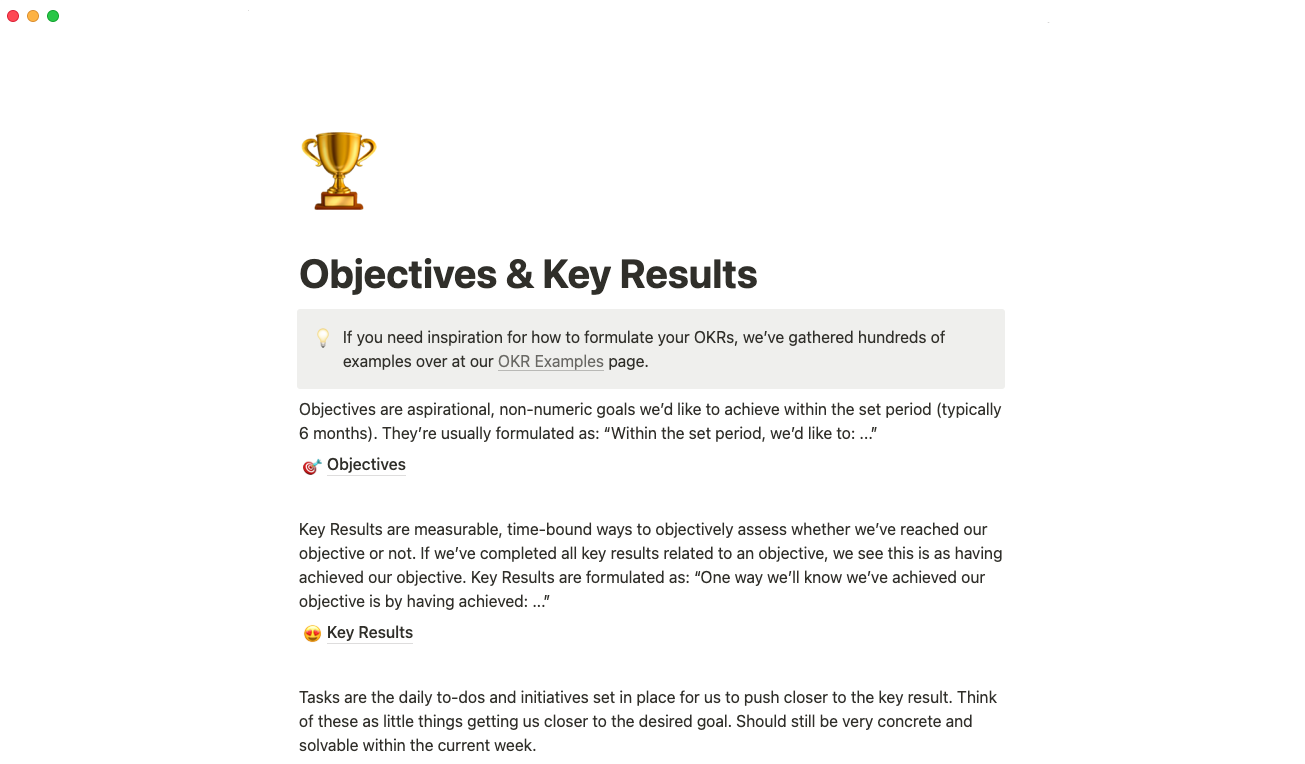
Using a KPI tracker, you can monitor real-time performance and view a quick progress report of your objectives and key results (OKRs). Typically, this dashboard provides a high-level overview with the option to zoom in on more granular data.
Why track your KPIs?
KPIs tell you if you're on track for success or need to adjust and realign your team or project. Alongside OKRs, which focus on setting and reaching ambitious goals, KPIs provide measurable data to determine how close you are to achieving those objectives.
Tracking KPIs also helps you:
Monitor financial wellness — through a comprehensive analysis of economic indicators like revenue streams, expenditures, and profit margins, KPIs offer a transparent view of an organization’s finances.
Gauge progress — KPIs are essentially yardsticks that measure company progress. By comparing current performance data with targets and benchmarks, you can assess how aligned your team is with broad strategic intentions.
Promptly identify issues — KPIs shed light on anomalies, inefficiencies, and deviations from the norm, allowing you to address potential concerns before they escalate.
Refine approaches — by continually monitoring performance metrics, teams can discern what's working and what isn't. This real-time feedback enables quick adaptation as businesses adjust strategies or processes.
Boost team morale — clearly defined and communicated KPIs offer teams transparent expectations. And achieving these KPIs can boost confidence, reinforce a sense of accomplishment, and drive motivation.
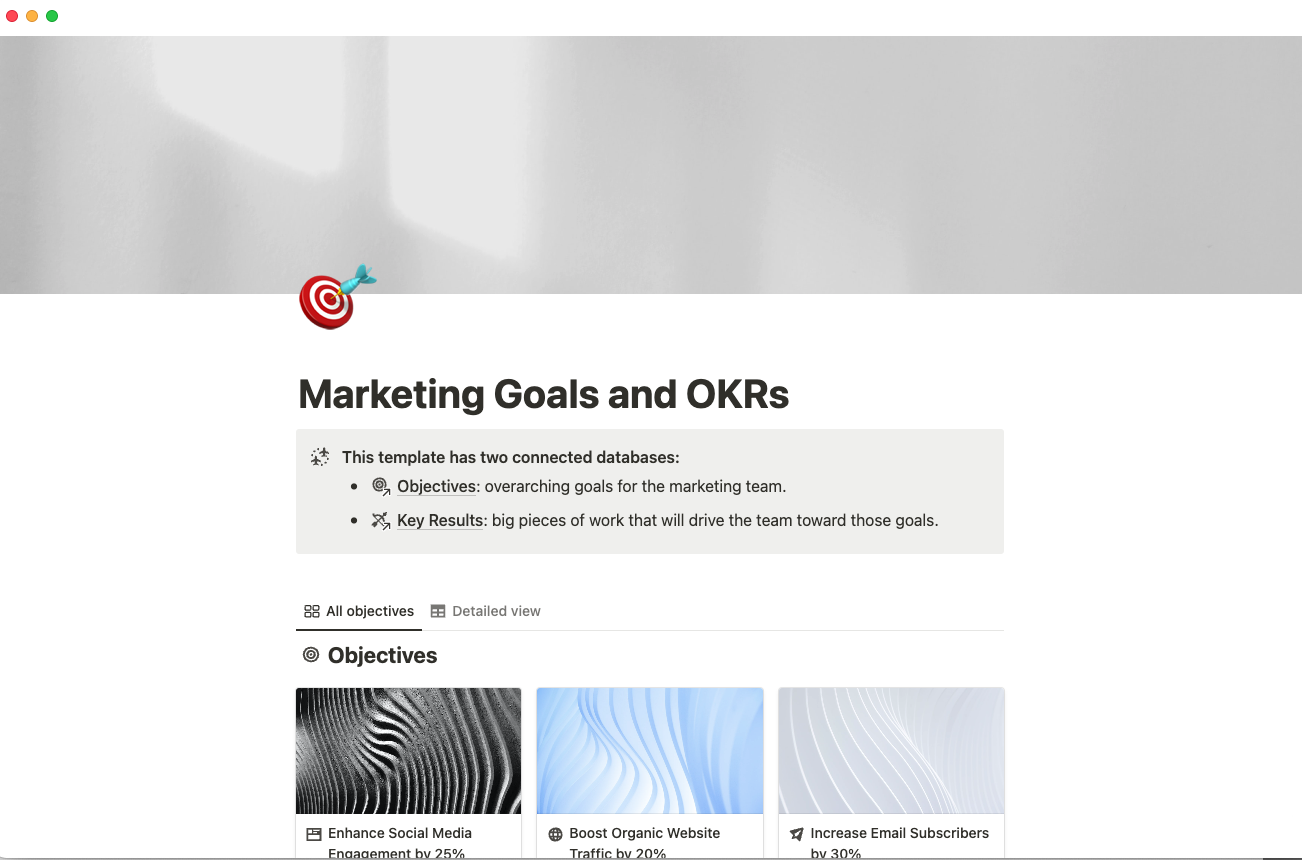
Make better decisions — with empirical evidence at your fingertips, you can quickly make strategically sound choices. That’s why many leaders use Notion’s marketing goals and OKRs template, which allows teams to set, track, and manage OKRs in one place.
4 common KPI categories
Industry-wide teams use KPIs, from sales numbers to software performance metrics to audience impressions. And most fit into one of four categories.
1. Strategic KPIs
Strategic KPIs are overarching metrics that serve as a barometer for an organization's broader trajectory. They focus on the company's mission, values, and long-term objectives.
Decision-makers and managers rely on these numbers to make informed choices about their team’s direction and determine if they’re on track to hit targets.
2. Operational KPIs
Operational KPIs involve the finer details of a team’s day-to-day functions. Managers use these metrics to ensure daily operations run efficiently and contribute to the organization’s bigger picture. And you might use this data to make operational plans that set your team up for success. Or you could use Notion’s OKR and project management template to improve operational efficiency, organize day-to-day tasks, and align projects with overarching objectives.
3. Functional KPIs
Functional KPIs zoom into the performance of distinct units or sectors within a corporation. Whether observing a marketing campaign’s efficacy, sales team’s ROI, or HR department’s retention rate, these metrics provide a more granular analysis.
Managers and department leaders depend on functional KPIs to strategize, allocate resources, and help their teams align with team-specific and organizational goals. And an easy way to formalize this work is by using tools like OKR templates, which make tracking metrics simple and orderly.
4. Leading/lagging KPIs
Leading KPIs are the foresight tools of the business world, providing insights into potential future outcomes based on current actions and trends. They help preemptively identify opportunities and challenges.
Conversely, lagging KPIs offer a retrospective analysis, shedding light on the results of past decisions and strategies.
When used in tandem, these two metrics present a holistic perspective, letting project managers understand their past, optimize their present, and strategically plan their future.
Why business leaders rely on metrics dashboards
Effective leaders create company-wide KPI dashboards to visualize performance across all critical areas. Paired with task dashboards, all managers gain a bird’s-eye view of project progress.
By providing straightforward overviews of performance, KPI dashboards also help the leadership team:
Enhance executive choices — using a dashboard, you can distill complex data into an easily digestible format. Visual clarity reduces the cognitive load and equips executives with insights needed for proactive, strategic decision-making.
Boost operational productivity — dashboards congregate metrics in a single, accessible space, eliminating the need to sift through disparate data sources. This centralization simplifies data monitoring, in turn enhancing the rate and quality of work.
Promote team unity and openness — by offering a unified data view, dashboards bridge various departments and teams. A shared perspective nurtures a collaborative spirit, ensuring all units move toward common goals.
Forecast business expansion — beyond presenting current data, dashboards assist with examining business intelligence and creating forecasts. Analyzing historical data patterns alongside current metrics lets leaders predict potential business trajectories.
Prioritize tasks and resources — dashboards illuminate areas that require immediate attention, helping leaders discern between nice-to-have items and essentials. By spotlighting these priorities, managers can focus on the highest-impact areas of the business.
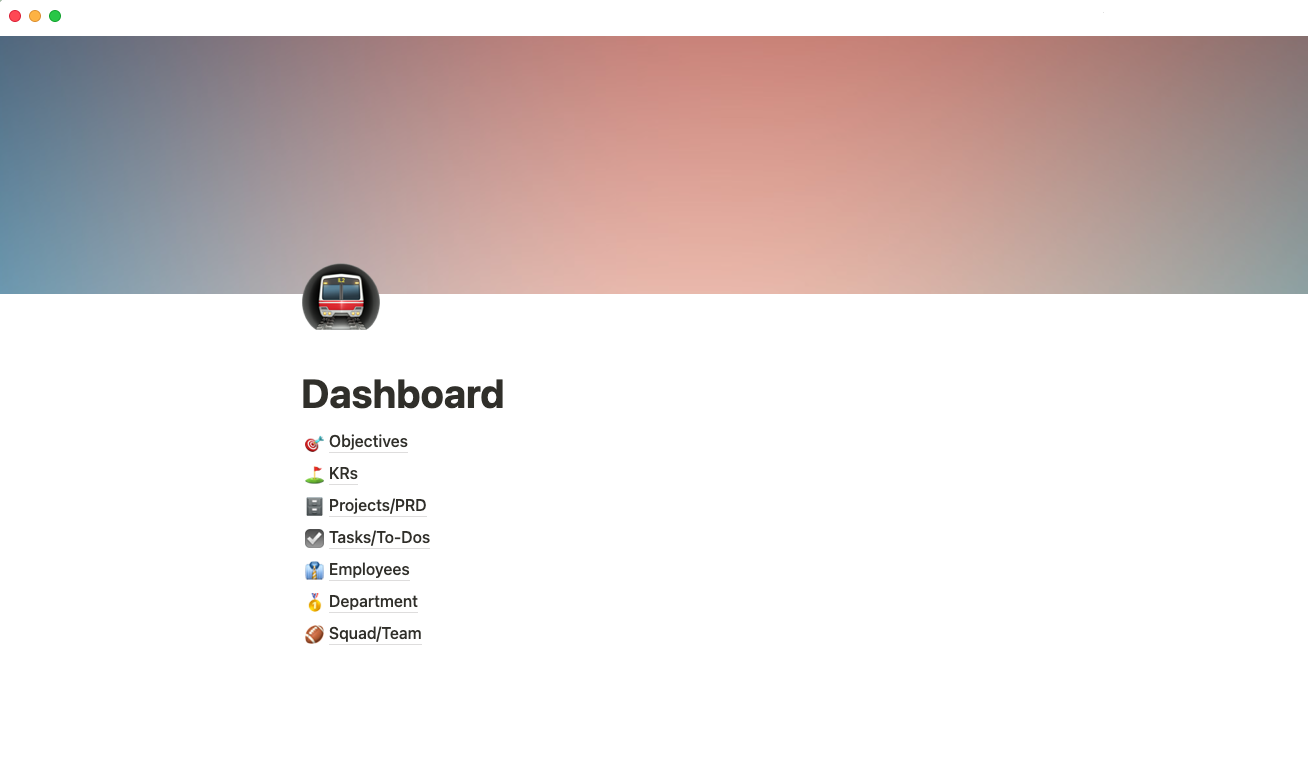
Offer real-time analytics — real-time analytics capabilities provide all stakeholders with current trends and performance updates. You can use a centralized dashboard such as Notion’s objectives and key results tracker to update your team with the status, priority, and timeline for all open tasks.
How to create a KPI dashboard in 8 steps
Setting up a KPI dashboard can be daunting at first as it requires learning new technology or software systems and gathering vast data. But this eight-step guide streamlines the process and ensures you don’t miss any crucial components.
1. Identify vital metrics
Determine crucial metrics for realizing team goals. These KPIs foster an understanding of the company’s current health. And regularly evaluating and refining these metrics ensures your dashboard remains relevant and aligned with evolving objectives, resulting in actionable insights and data-driven decision making.
2. Engage your team
Conduct active discussions with team members, including department heads and key decision-makers, about how they’ll use the dashboard and what they’d like it to include. Considering various perspectives lets you address multifaceted business challenges. And your team’s combined insights will contribute to a well-rounded overview that caters to various departments, making it a universally beneficial tool for the organization.
3. Outline essential dashboard features
Draft a preliminary layout for your metrics dashboard. An outline will give you a sense of structure, aiding prioritization of information. Consider the sequential flow of data, emphasizing key metrics and ensuring pivotal data stands out. Your design must make information access simple, fast, and efficient, reducing time spent interpreting complex datasets.
4. Choose the right software
Select a software solution that best meets your determined needs. The optimal choice will offer flexibility in design and scalability for future expansion. And the platform you choose must integrate with your current data repositories for uninterrupted data flow and consistent reporting.
5. Collect crucial data
Collect accurate, up to date, and relevant data on the projects and broader operations you want to track, always prioritizing quality assurance checks to uphold data standards.
6. Design the visual elements
Transform your raw data into visually appealing formats. Use clear graphs, concise charts, and other data visualization tools to present information without ambiguity. The aim is to render data instantly understandable, eliminating the need for extensive analysis. For inspiration, you can refer to various KPI dashboard examples available online, which provide insights into practical design and layout practices.
7. Review and refine
Before rolling out the dashboard company-wide, seek feedback from end-users. Their firsthand experience with the tool will highlight potential issues, areas of confusion, and suggestions for improvement. This iterative process is crucial in refining the dashboard to make it more user-friendly and effective at conveying information.
8. Launch the finished dashboard
After making adjustments, unveil your dashboard organization-wide. Make a team dashboard accessible to all intended users, and if the interface or features require it, consider offering instructional sessions or guides. Proper training eases the adoption process as the dashboard becomes an integral, value-adding tool within the company's daily operations.
Visualize and succeed with Notion
Rather than starting from scratch, use a template to get started with your KPI dashboard. Notion offers templates like the Objectives & Key Results Tracker, which aligns teams on goals and responsibilities. Sign up for Notion to explore the template library for ways to improve your KPI tracking.