When you’re on a long trip, seeing the route left to your destination helps keep you grounded and alert, and understanding how far you’ve come keeps you motivated.
Visualizing project progress feels similar — a team can see the proverbial light at the end of the tunnel, stay motivated, and stick to the course, and teammates can congratulate each other on completed milestones.
Burn-up charts help teams visualize this progress. They’re a constructive and well-defined way to keep a project on track and mitigate scope creep.
What’s a burn-up chart?
A burn-up chart visually represents a project’s progress. This tool is part of the Agile project management methodology and involves tracking completed and in-progress story points (numbers that estimate the impact of the work needed).
Burn-up charts consist of Y and X-axes. The Y-axis generally reflects story points, but you could use this axis for hours worked or tasks. The X-axis often monitors project or sprint time, sometimes in the form of subsequent iterations. These charts typically plot two lines: total work (the work the team plans to perform at the project’s start) and work completed. The total work line won't change throughout the project unless the scope shifts.
When to use a burn-up chart
Agile-driven teams might find using burn-up charts intuitive and easy to implement. Since burn-up charts can functionally track story points versus iterative processes, like sprints — which development teams often use — these visuals benefit software or product development teams.
That said, any project that takes an iterative approach, requires constant communication or close collaboration, and thrives on piecewise or timely deliveries is a strong candidate for this model. Teams that don’t follow the Agile methodology can adapt the axes to the metrics they use to track projects.
Burn-up versus burndown charts
Burn-up and burndown charts are project-tracking tools that work slightly differently, and strategic teams can use both types of burn charts in tandem.
An Agile burn-up chart reflects a team’s progress by tracking tasks against sprints and demonstrates scope changes as needed.
A burndown chart in Scrum or Agile, on the other hand, focuses on the time and tasks remaining. These charts show the ideal trajectory of progress and when the team will complete a project or sprint, and the team can use this chart to track deviations. Burndown charts don’t make concessions for scope shifts. If a team is behind or ahead on tasks, the graph only shows the digression from the plan without shifting to accommodate it.
Teams can use both charts simultaneously, monitoring progress and appreciating achievements with a burn-up chart, and envisioning how much time they have left with a burndown chart.
The benefits of using a burn-up chart
Burn-up charts are valuable documents that ensure projects run smoothly. They do so by offering the following benefits:
They’re flexible — since these charts reflect scope changes, teams can deviate from the original plan. If you underestimated your workload or the time necessary to complete it, you can adapt the chart to reflect changes.
They reflect the project backlog — burn-up charts show team progression, reflecting accomplishments. A burn-up chart also serves as a living record of the project backlog items the team has ticked off.
They track scope — burn-up charts represent how close teams are to initial projections regarding the intensity and timeline of the work and scope changes. This document can be vital when explaining delays or shifts to clients or other stakeholders.
They help you plan future projects — past burn-up charts become excellent resources for future goals. Project managers can assess how close the work ran to the original plan and what roadblocks they faced. These charts can even help managers plan sprints, as they’re constantly viewing this document and evaluating the success of iterations.
How to create a burn-up chart: 5 steps
The best way to understand how burn-up charts work is to create one. You can generate a graph for an upcoming project or sprint using the following steps:
Determine scope — define project to-dos to categorize priorities and illuminate unnecessary work. If you need guidance, use a program evaluation and review technique (PERT) chart to gain a visual understanding of what your team must complete to meet project expectations.
Set a timeline — divide the work into sprints or iterations. You can consider a period of 2–4 weeks for each sprint or use your knowledge of similar projects to determine the timing. Then line up your sprints to arrive at the total project timeline (your project will take 12 weeks if you have six two-week sprints, for example). A PERT chart can also help you determine timelines, as teams use them to set milestones and decide how much time they need in order to complete related tasks.
Set story points — choose the relative involvement of each development feature with the help of team members who will do the work. Thanks to their specialized knowledge, these individuals can accurately project the number of hours the work will take.
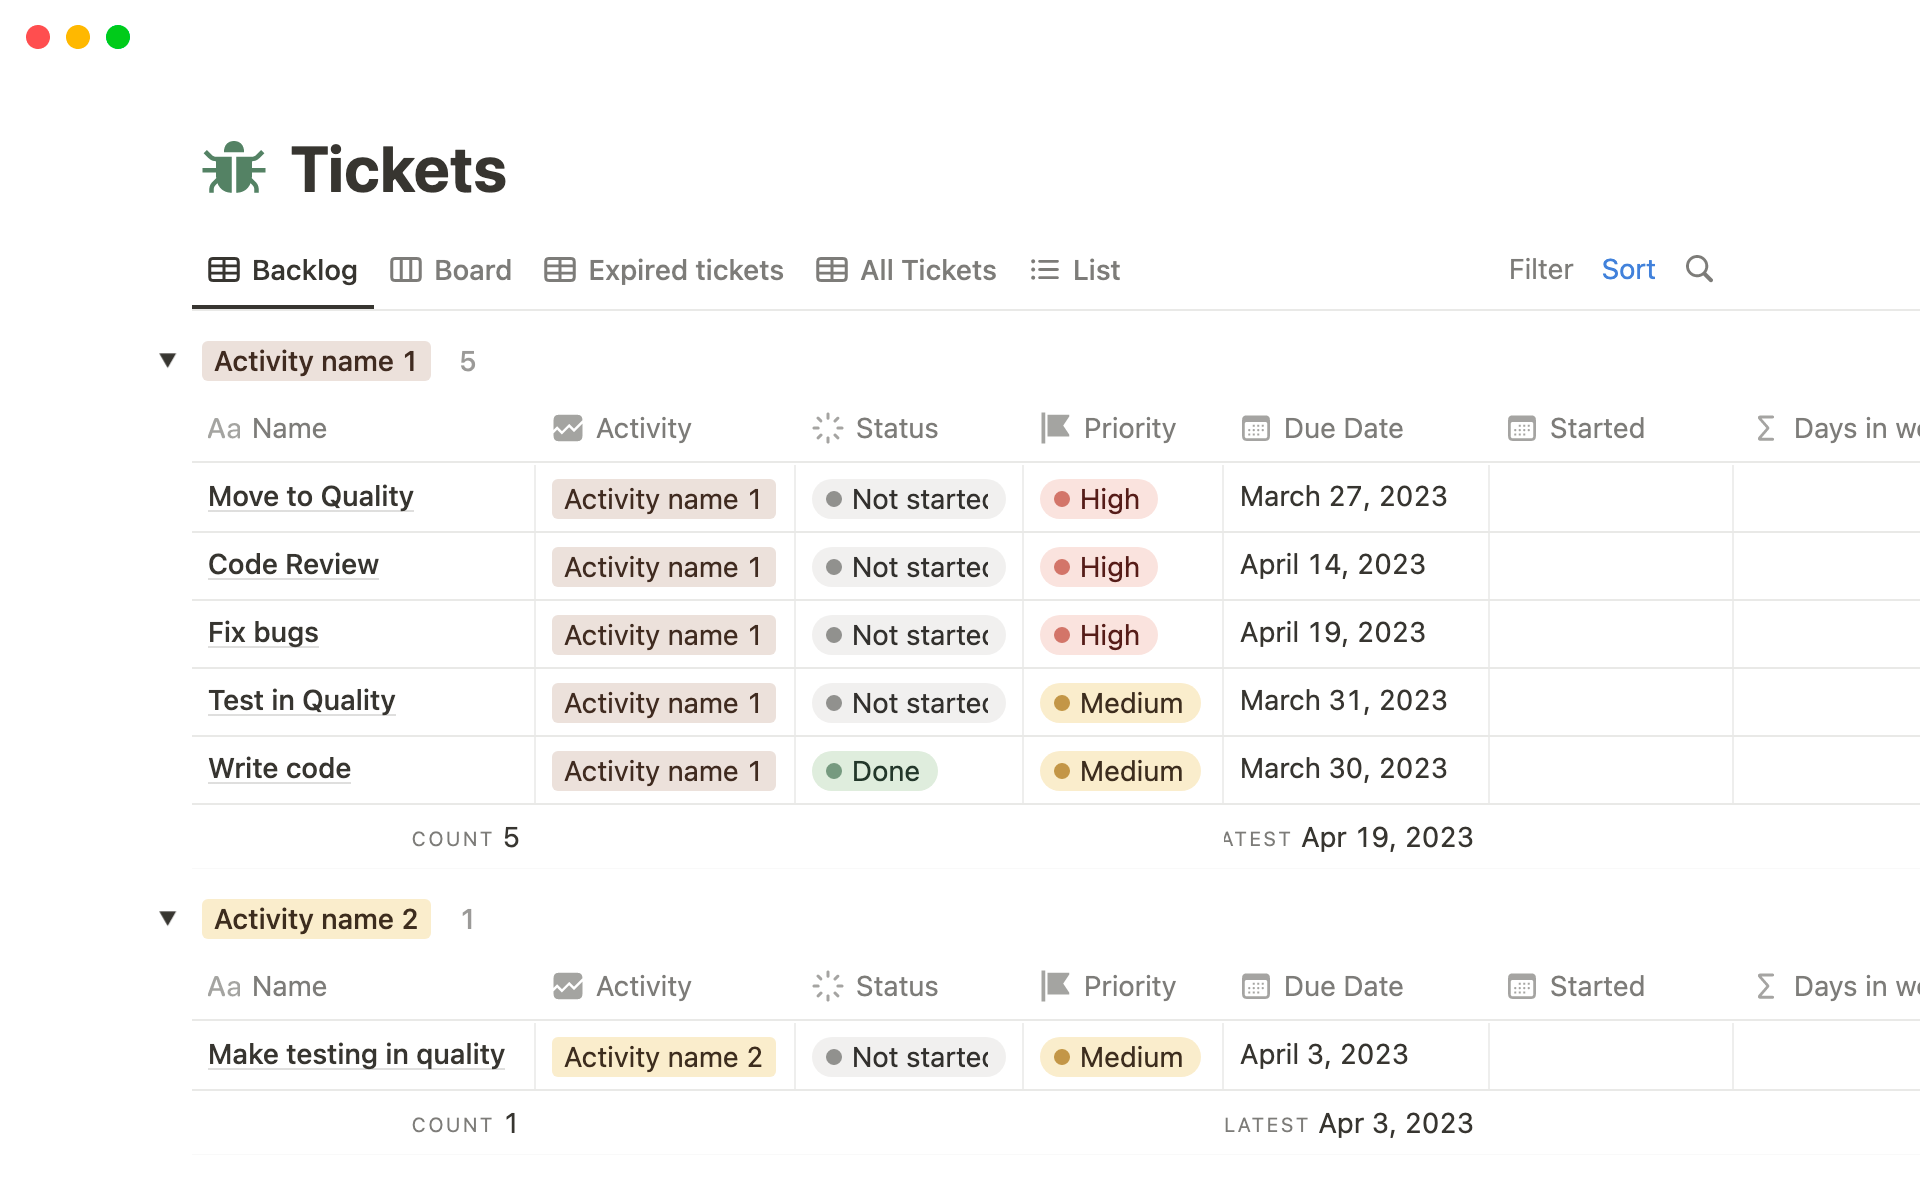
Plot your graph — use project management software or a worksheet, like Notion or Excel, to plot your burn-up chart. If you’re using a tool like Notion, enter your initial data into a table, update it throughout the project, and refresh the plotting as needed.
Stay flexible — the benefit of using a flexible project planning tool is that it allows your team to be agile. Everyone should update the burn-up chart daily to reflect shifts or work that isn’t flowing as planned.
Manage seamless projects with Notion
Most projects have various moving parts, and trying to plan a successful project without trackers and templates is challenging, so lean on these resources for support.
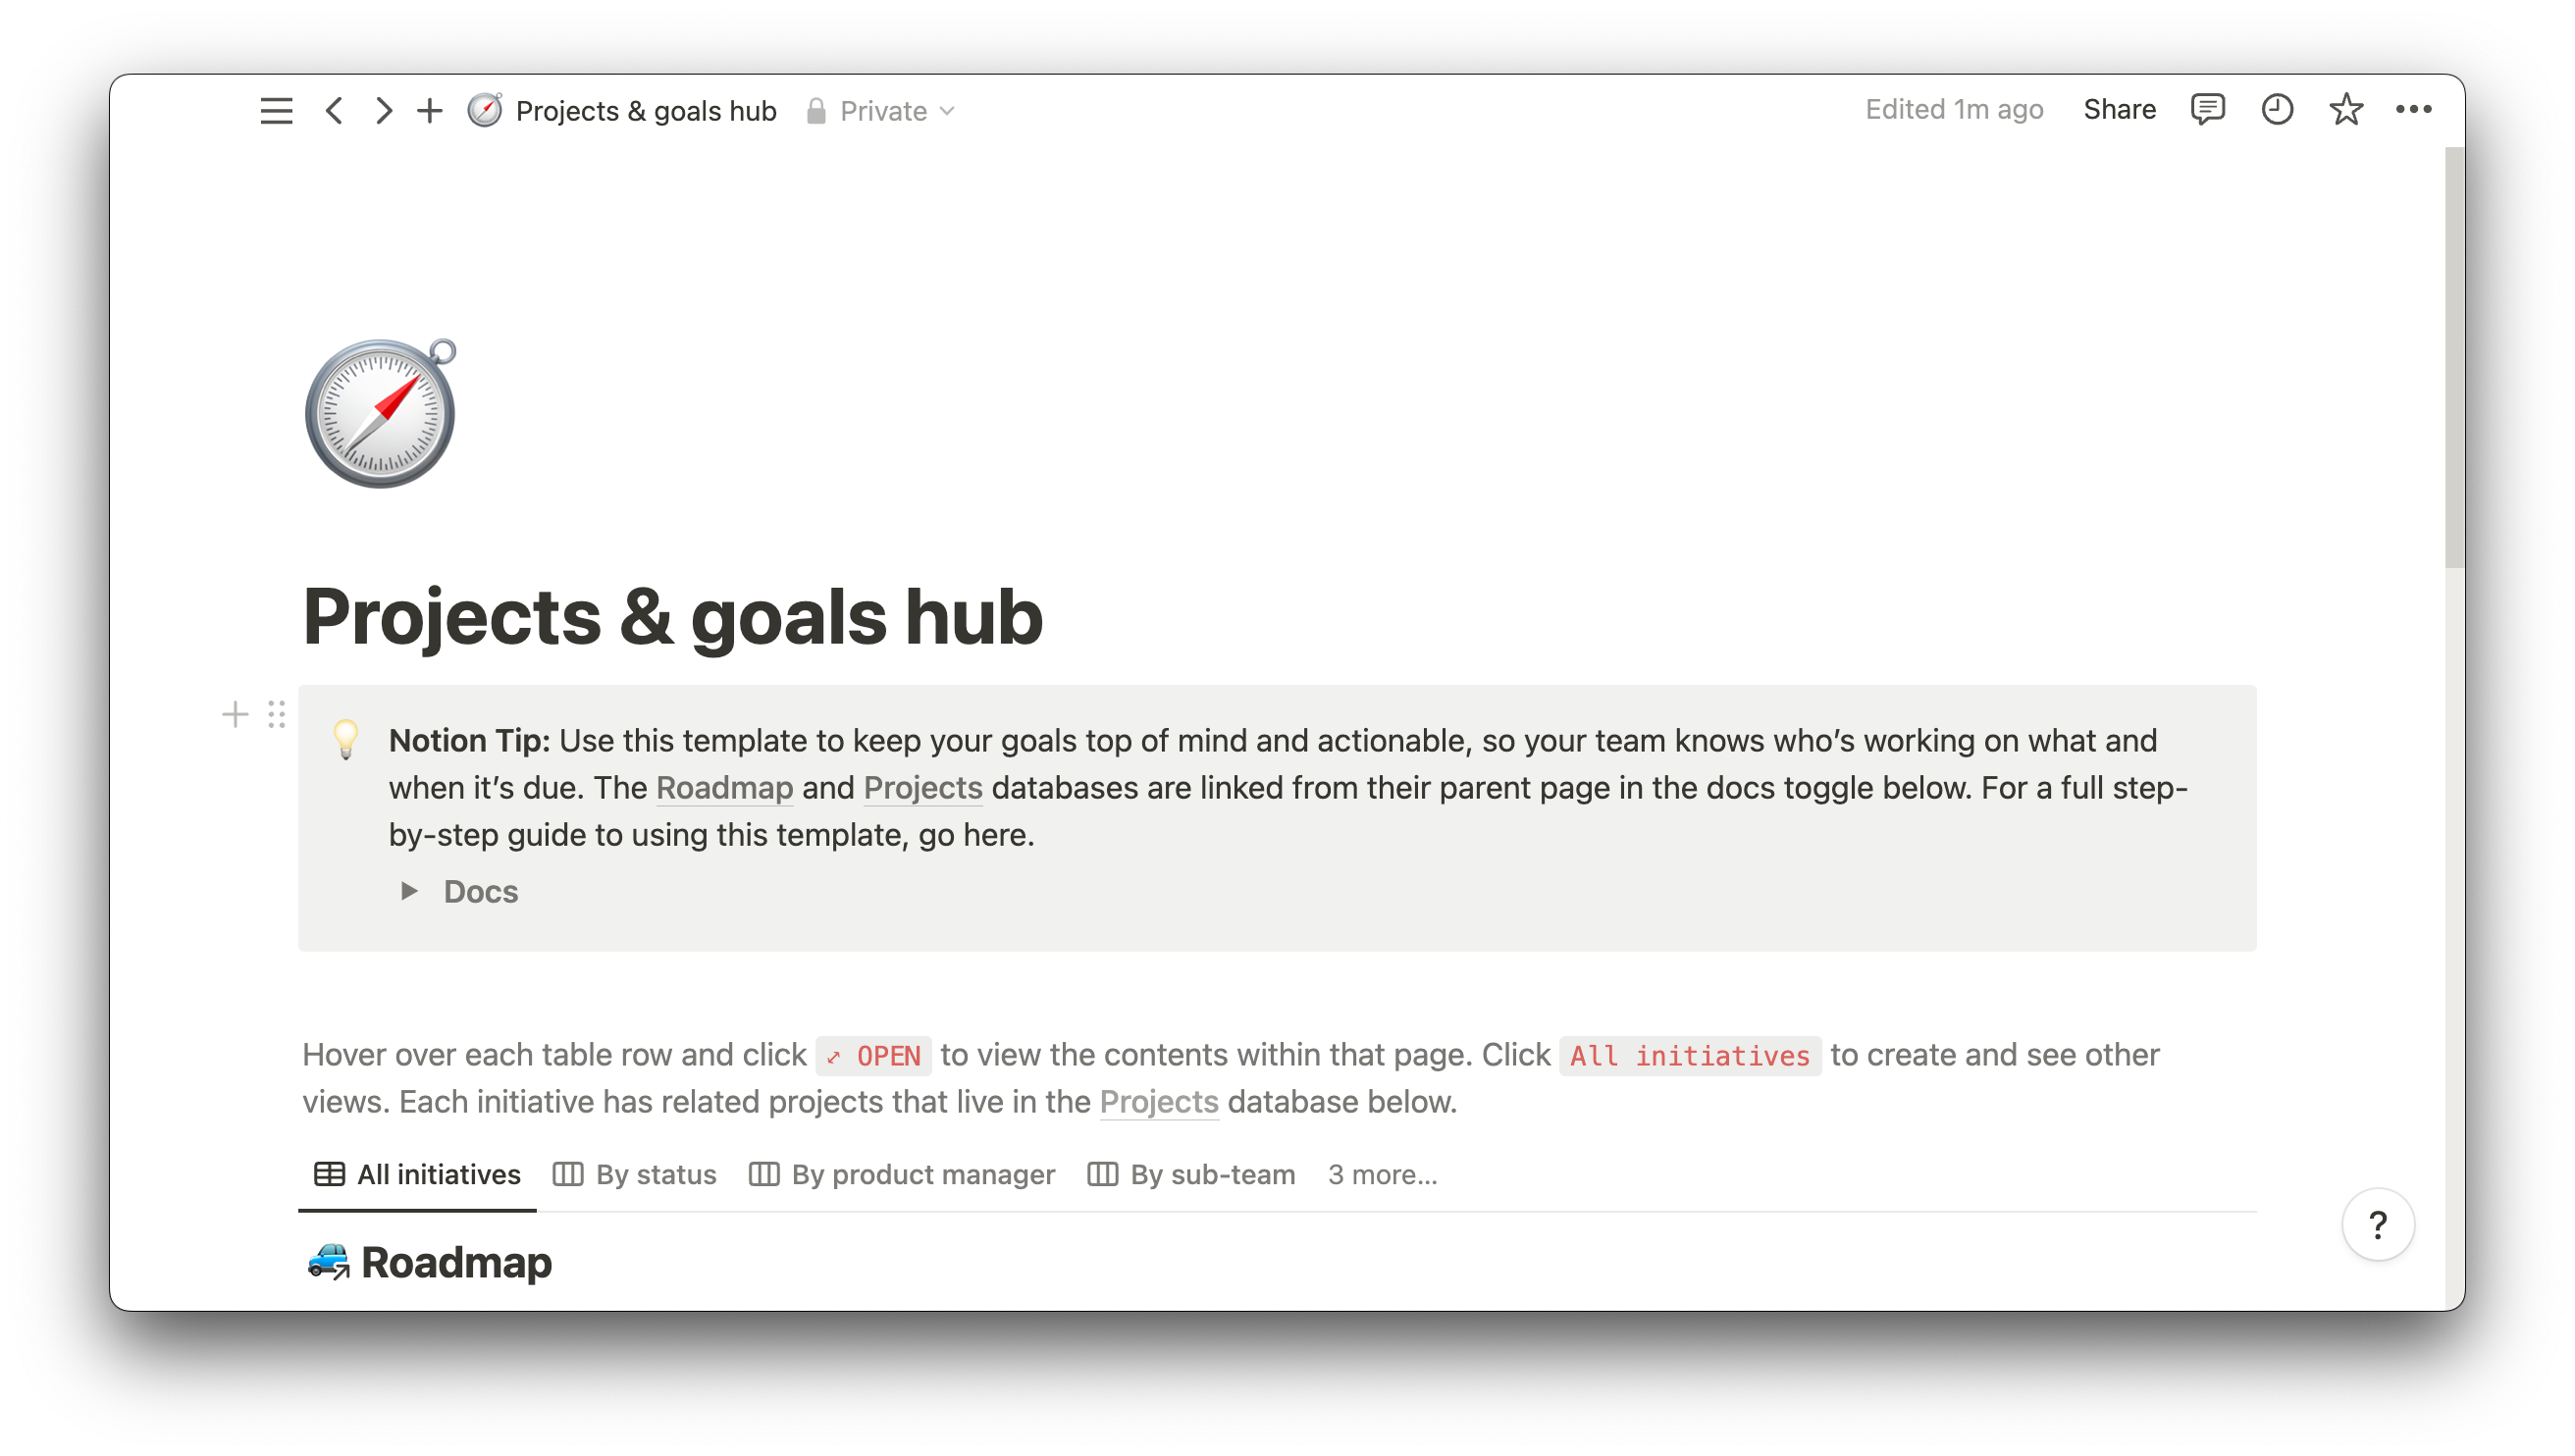
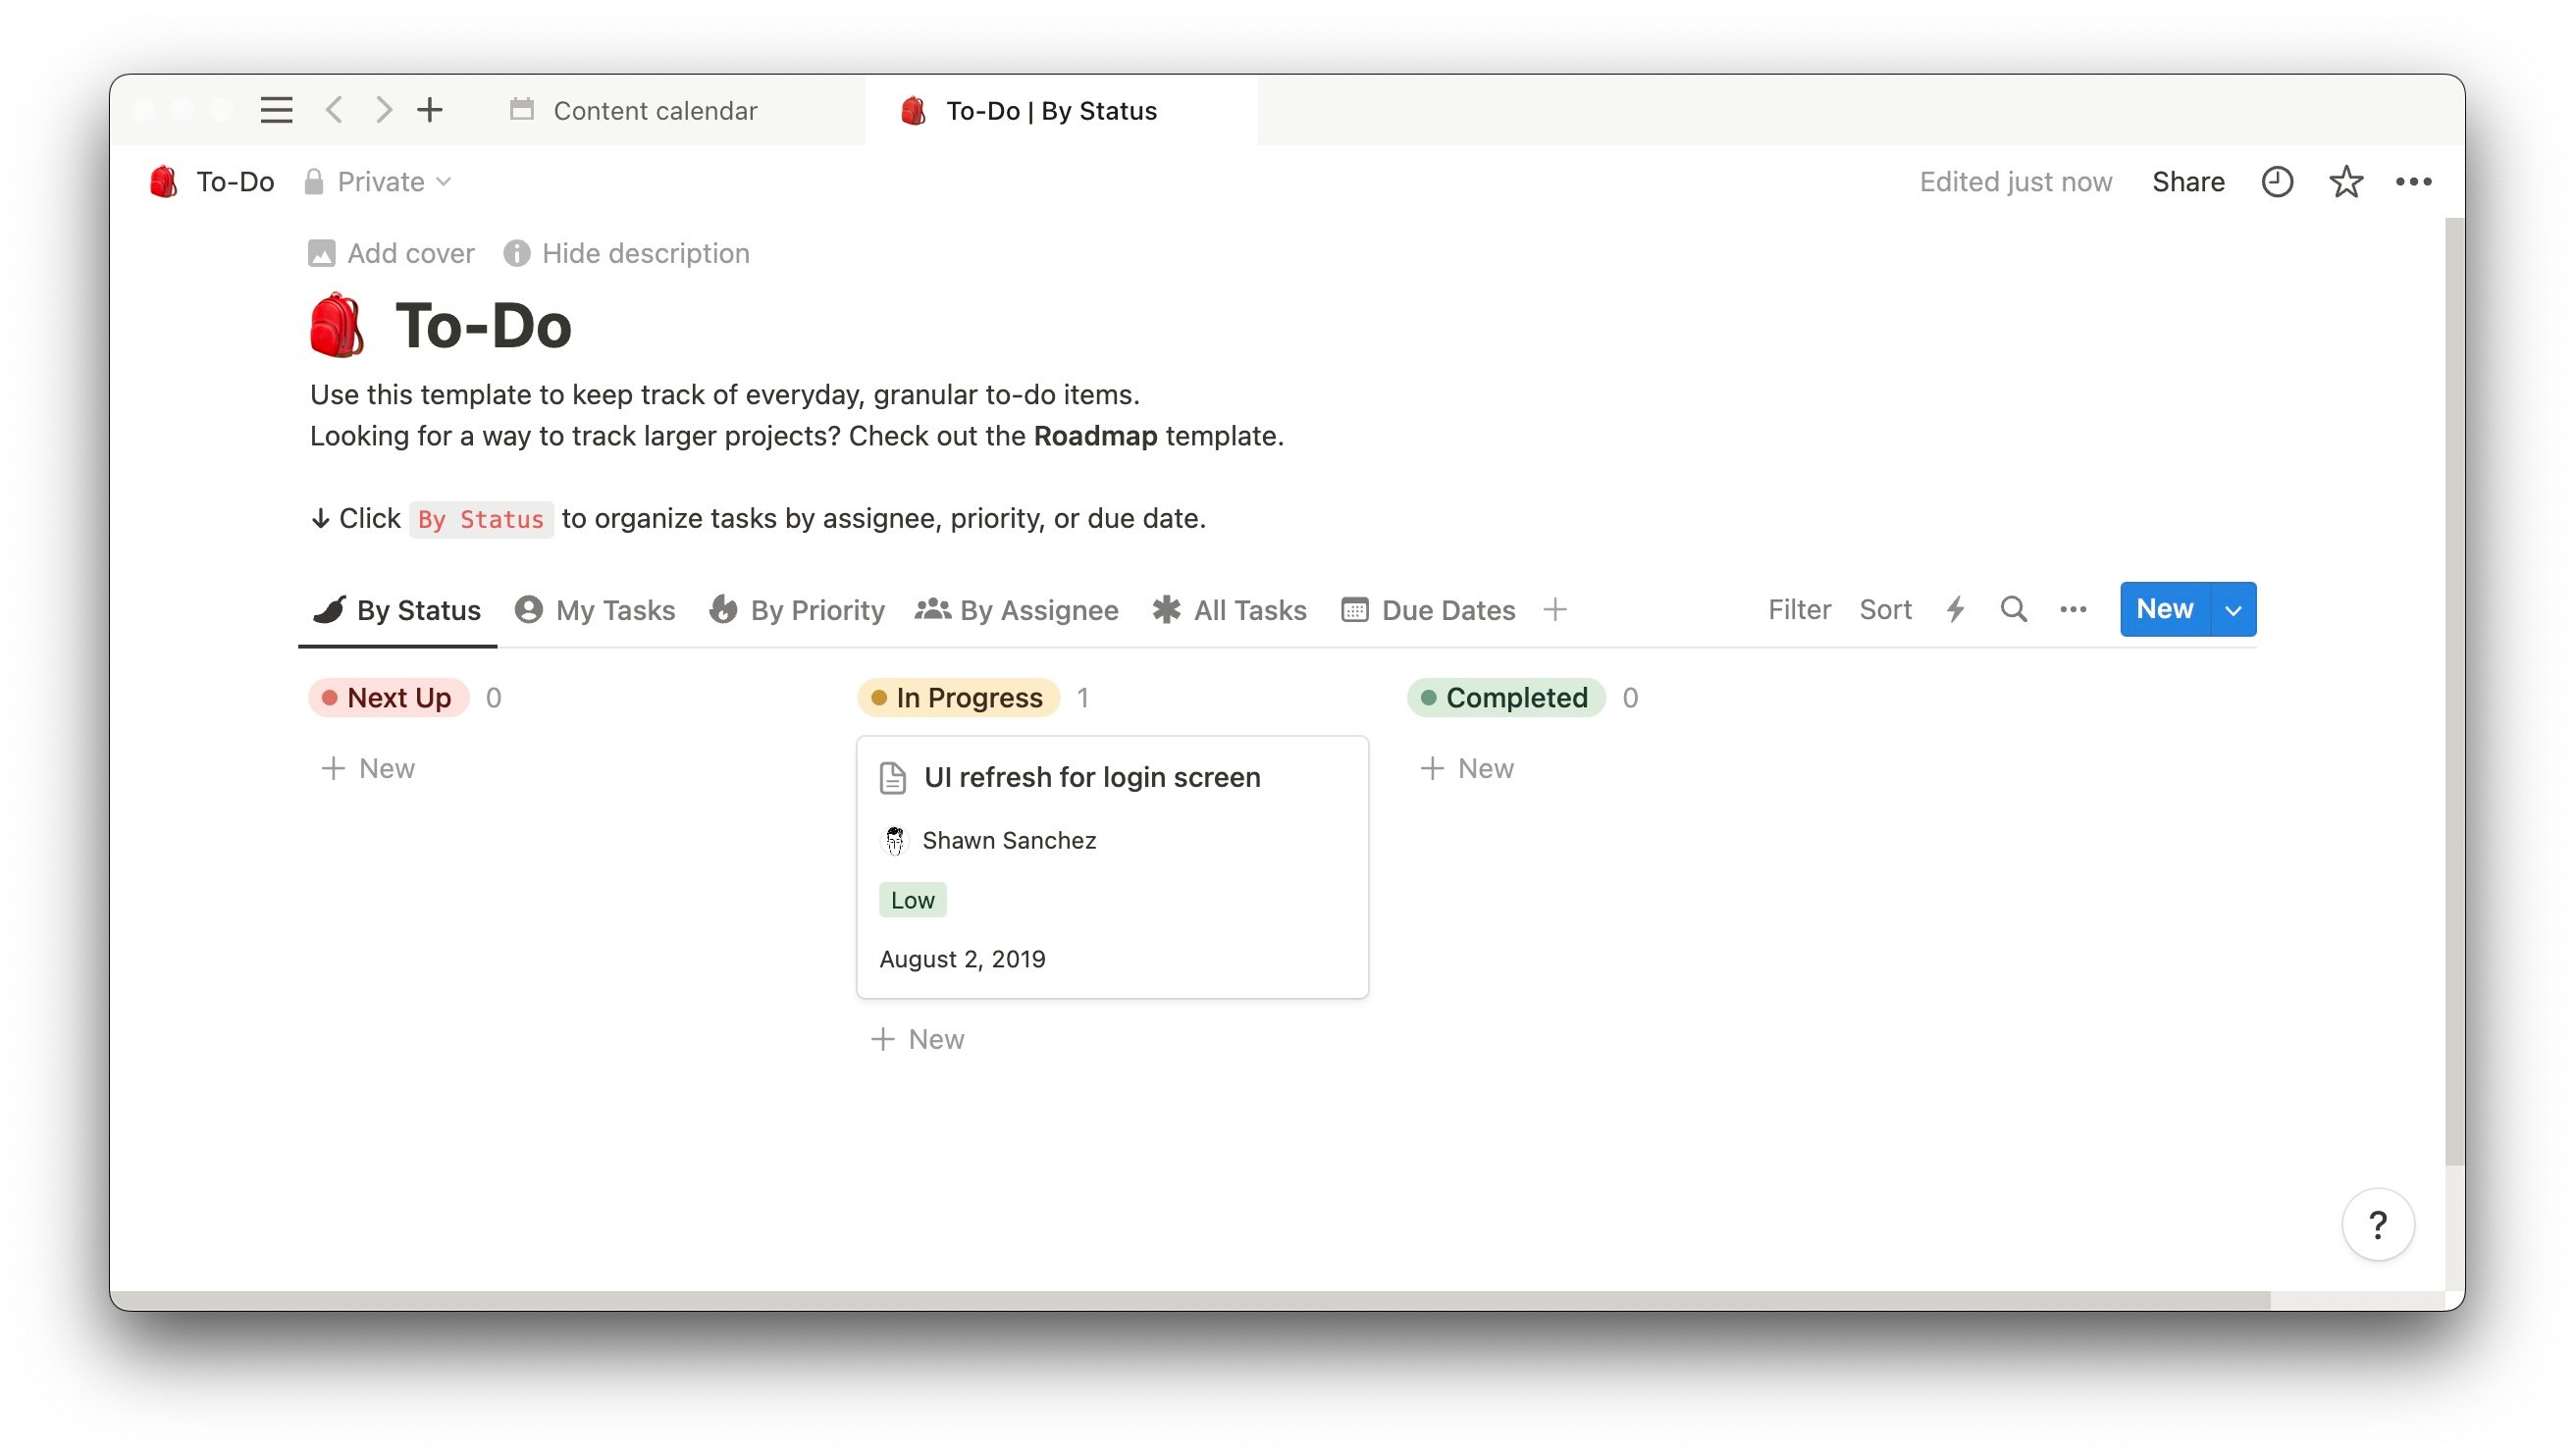
Notion offers templates and articles that help project managers organize work. Use the project roadmap template to determine tasks and set up sprints, the project goals hub to align team objectives with overall company ones, and the task tracker to stay the course. And check out our blog to learn how to create a project timeline or team wiki.


