Notion on Android is now more than twice as fast to launch
Por Karn Saheb
Engineering

Notion is a tool for thought, so it must operate at the speed of thought. We’d long heard feedback that our Android app was hard to use because of how long it took to start up and how slowly it performed. When you’re trying to jot down a thought, create a new task, or respond to a comment, a slow app startup can be a dealbreaker. So, starting in 2020, our team spent several months researching ways we could improve app performance for these everyday tasks.
The result: The Notion Android app launches more than twice as quickly today, as it did at the start of 2023. Here are some of the steps we took to improve performance, and our ongoing efforts to enhance the mobile experience for all our Android users.
Migrating from web to native code
The Notion mobile apps used to be simple wrappers that opened the web app in a WebView. Then, in 2020, we decided to leverage more native code in early product experiences. Migrating high-visibility, high-interaction product surfaces from web to native code improved performance in both native layers and the web app by leveraging the capabilities of the Android OS and its framework libraries.
In 2021, we increased our investment in native infrastructure to support Notion’s complex data model, including building support for querying, caching, and real-time updates to Block data. These investments delivered early performance wins in web app loading times while also laying a foundation for future caching and querying efforts.
We introduced the native Home Tab in 2022, which delivered a 3x improvement to perceived app startup, and the native Search Tab in early 2023, which improved loading time by more than 80 percent.
Identifying performance bottlenecks
When launching the Notion app, the first screen that people usually see is the Home Tab and its content (e.g Favorites, Private, and Teamspaces). This user flow, which is called Initial Home Render, is our analog for measuring app startup performance.
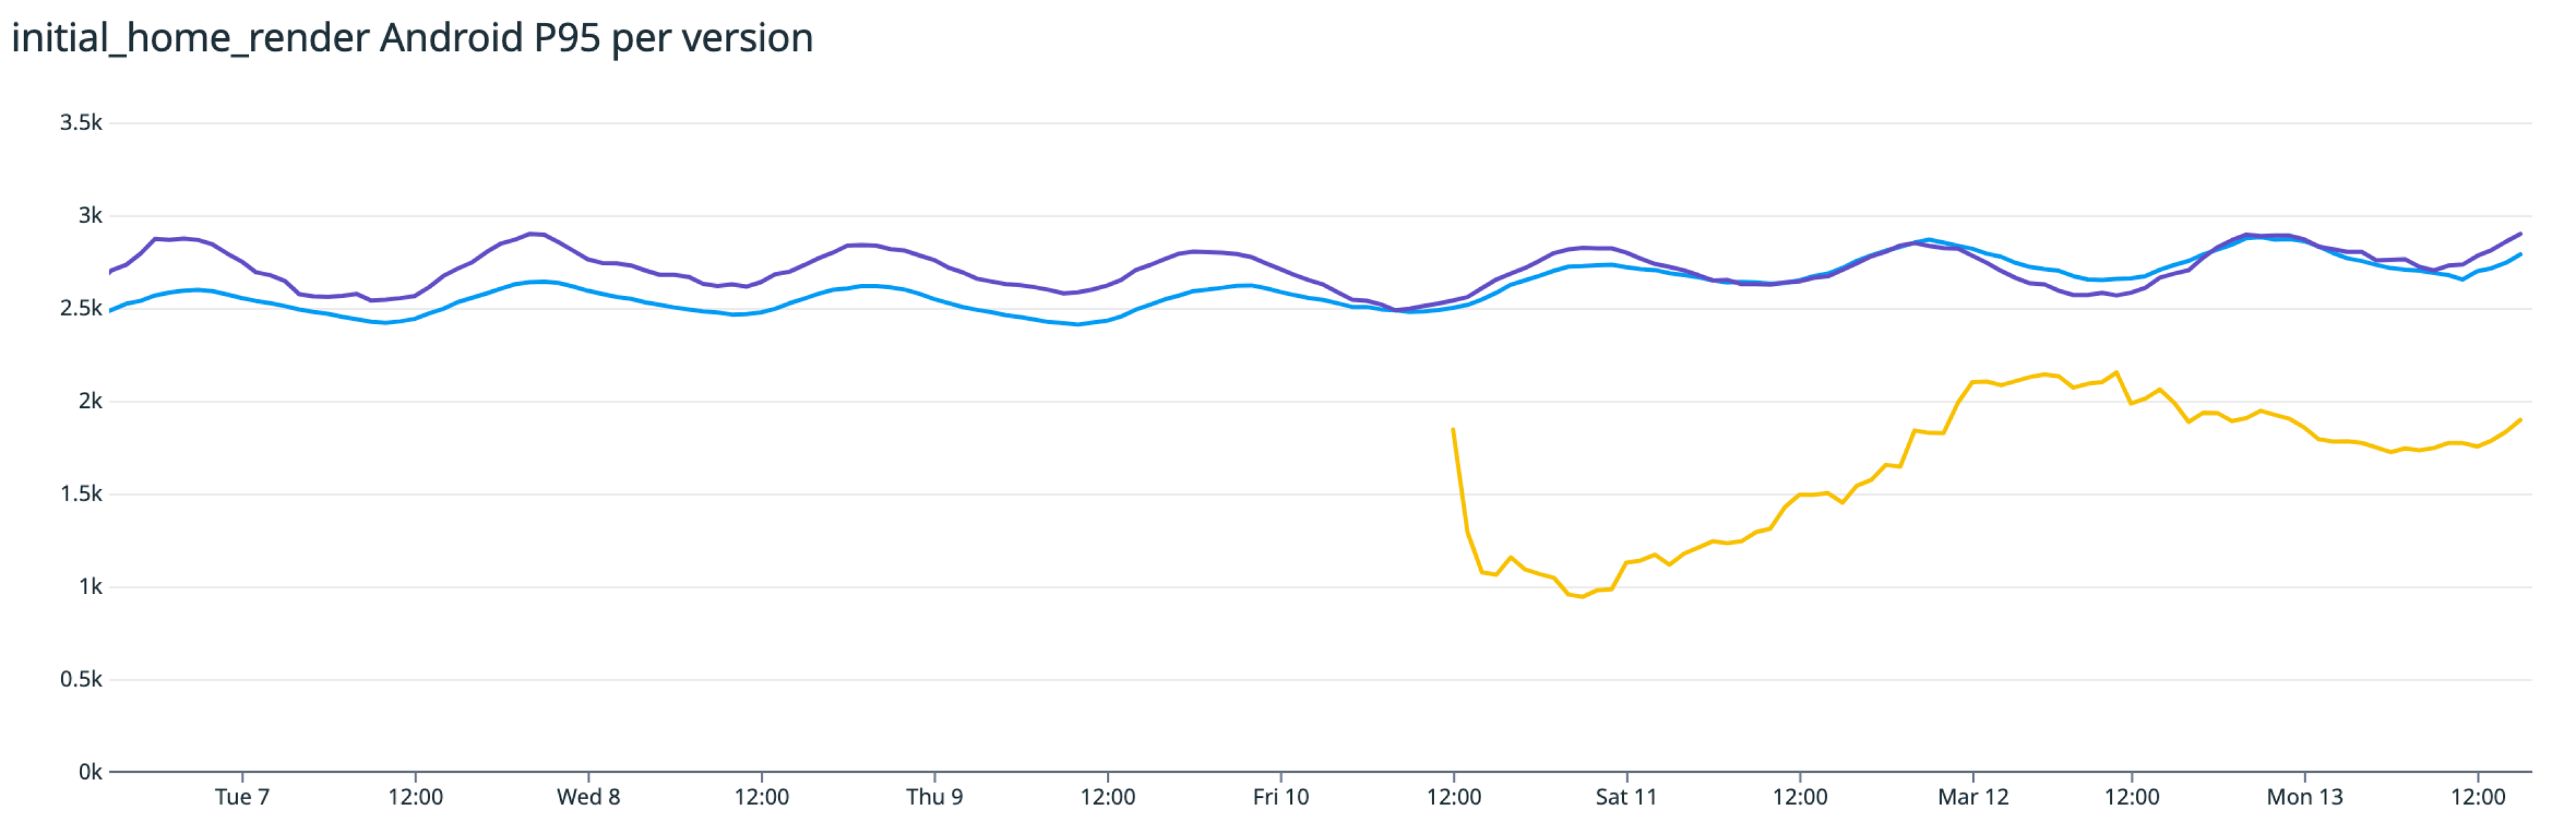
Our first task was to identify which parts of the Initial Home Render were taking longer than expected. The corresponding metric, initial_home_render, is sampled from all production app sessions and decorated with additional metadata (e.g., device configuration and session state) to aid with analysis. We focused on the 95th percentile (P95) when doing our analysis since this is the threshold that represents the experience of a vast majority of people.

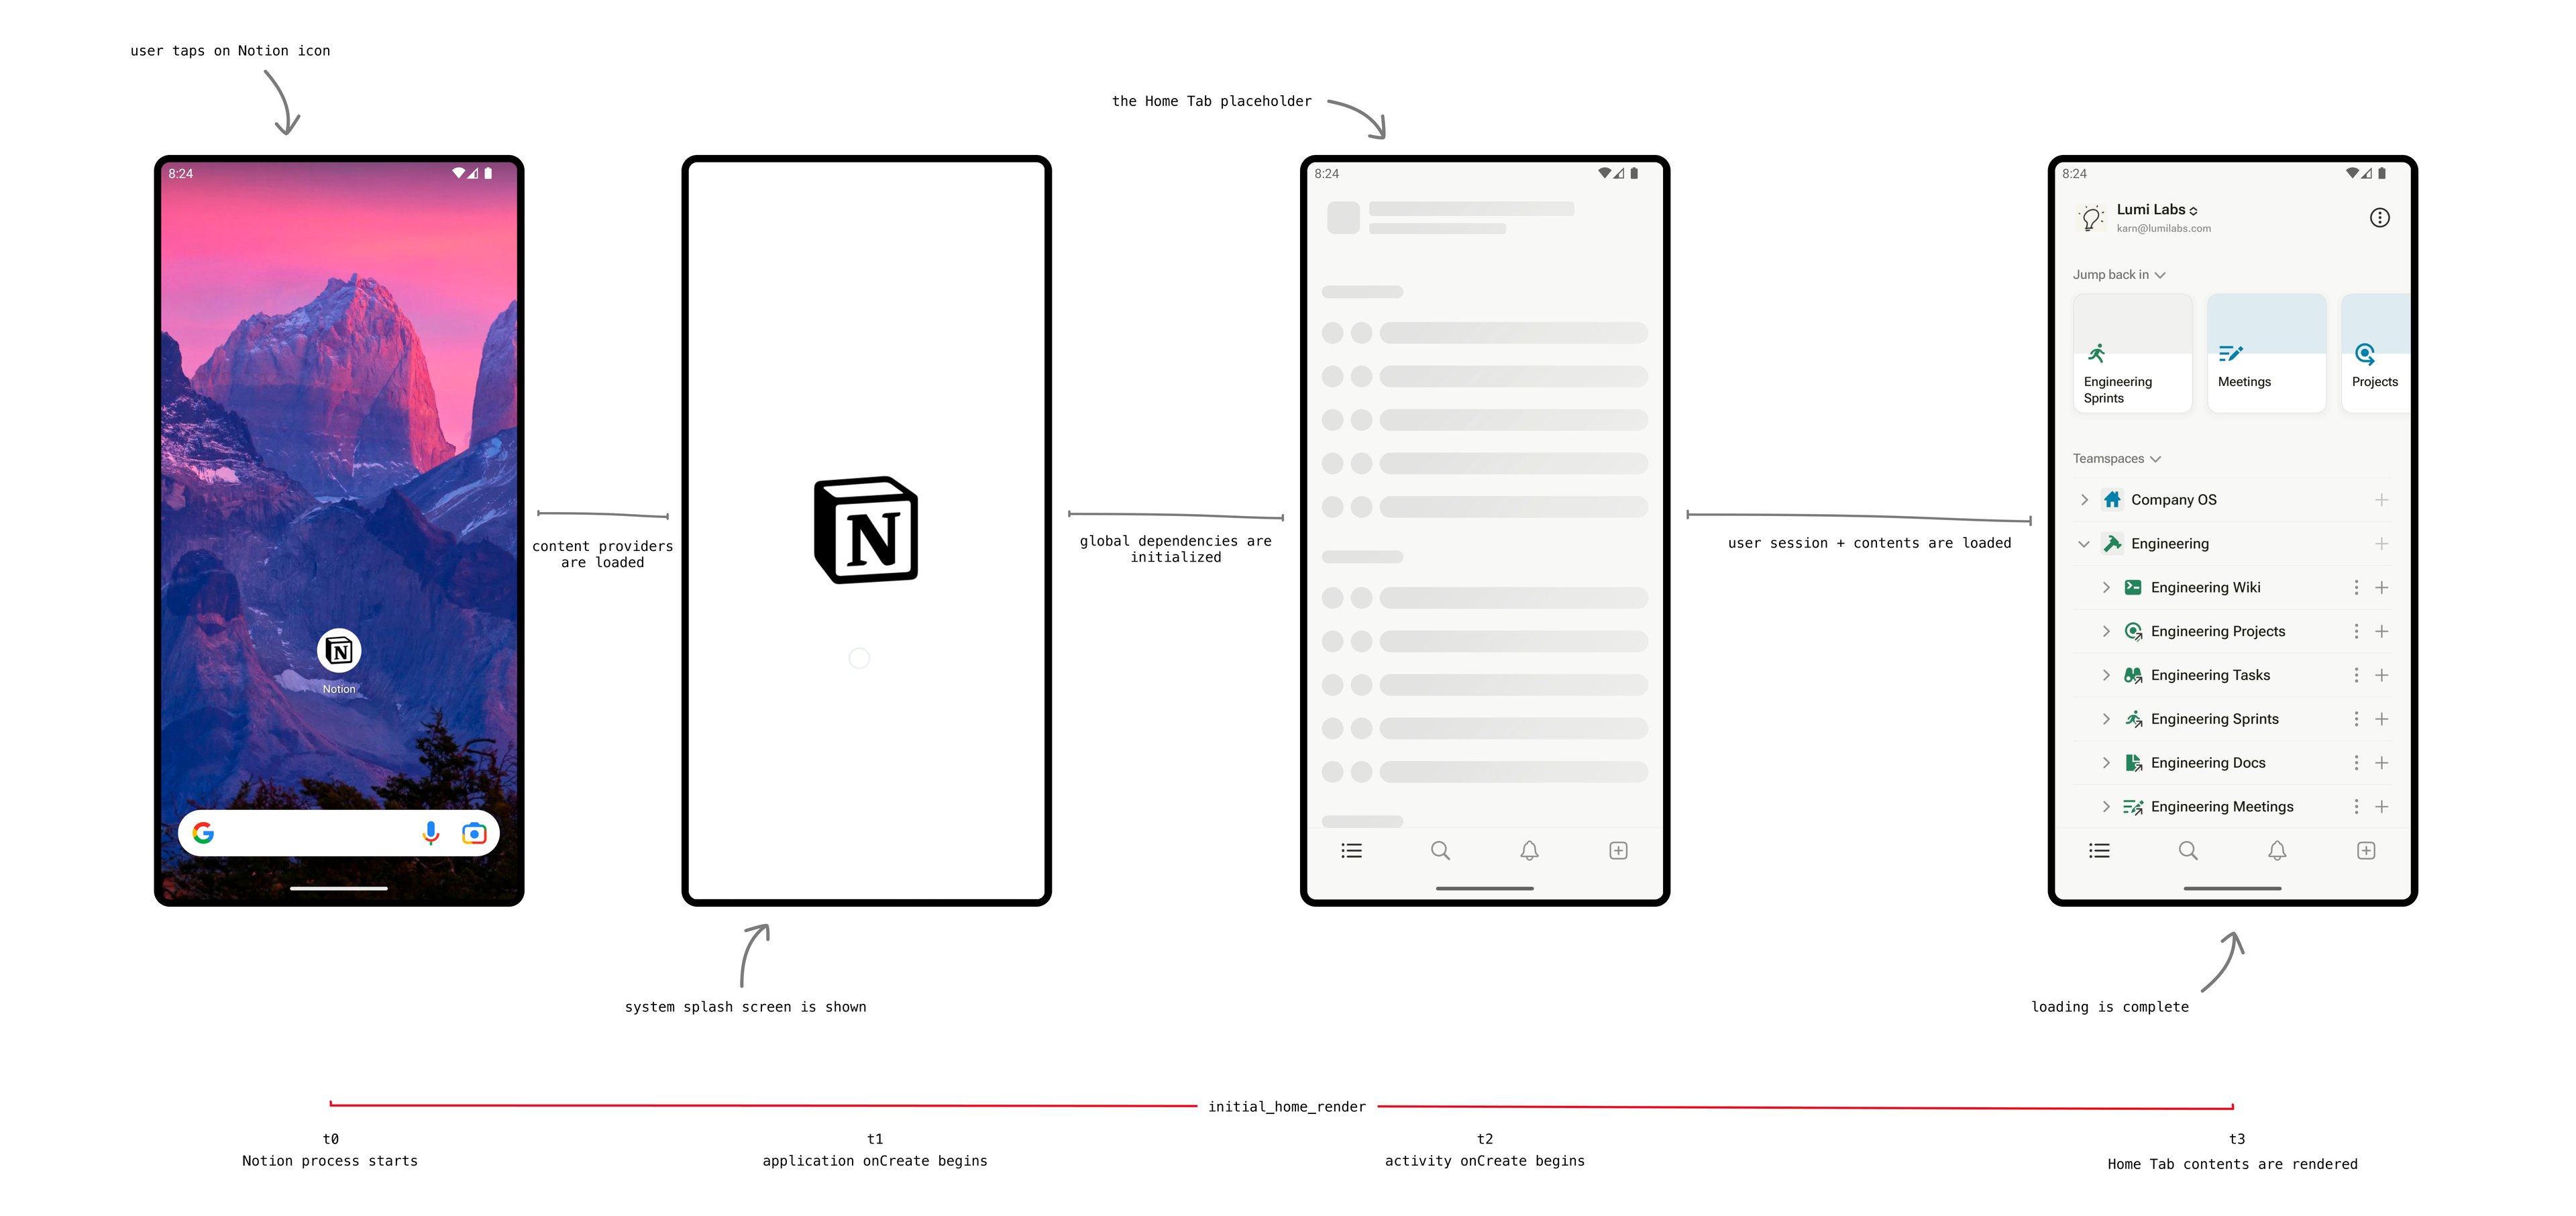
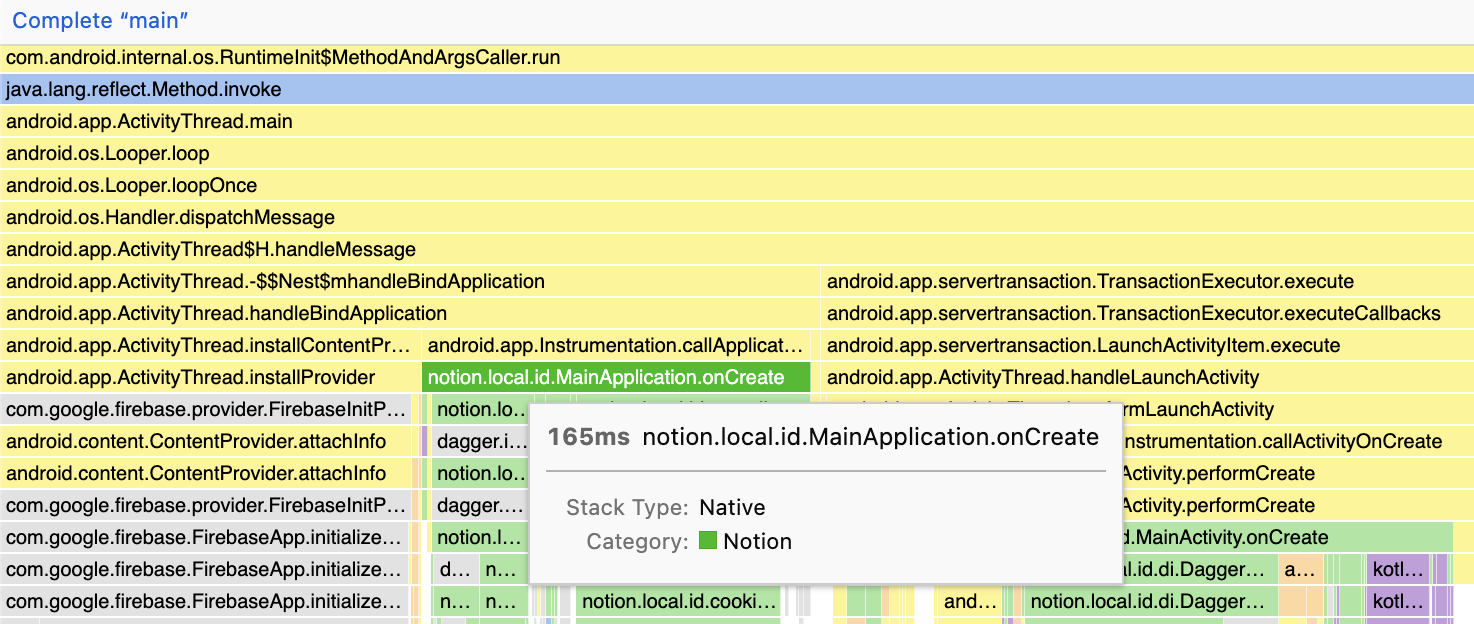
Within initial_home_render we measured several smaller segments/sub-spans where heavy initialization steps are performed and, over time, new dependencies are created and configured. For example, we measured the Application onCreate function, which serves as the app’s entry point, to see how long it was taking to set up global objects like Dagger components and third-party libraries. We also measured the main Activity onCreate, where objects and state for rendering the Home Tab UI were being initialized.
With the help of these sub-spans we were able to identify areas that might be affecting startup speed. But this was only a high-level view. To get to the root of our performance issues, we were going to have to get much more granular with our data.
In search of more detailed insights, we manually profiled various low- and mid-range devices using a combination of Android Studio CPU Profiling and Perfetto traces in test environments. We then viewed these code execution profiles as flamegraphs using tools like the Android Studio Profiler and Firefox Profile Viewer. The visualizations illustrated where the device CPU was spending time during startup.

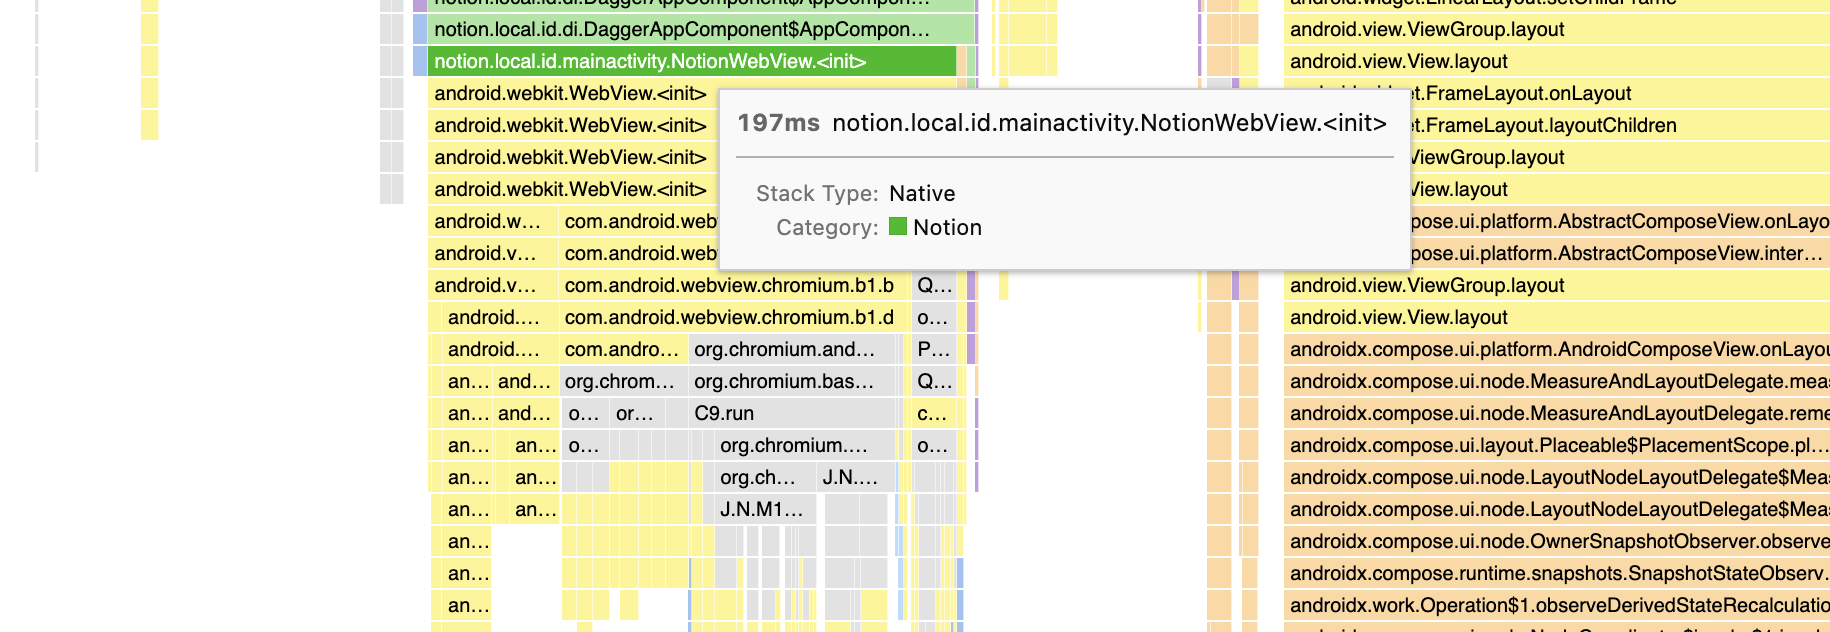
In the newly generated traces, we searched for wide singular spans that usually indicate slow code execution, which in turn often means performance bottlenecks.
Some of these spans appeared in worker threads, where we often expect to have long running execution for Network/Disk IO, JSON serialization, and complex database queries. Others were in the main thread, where most of the UI rendering was taking place. Whenever the main thread was doing something other than rendering the UI, the system would often skip frames and the user would experience jank, stutters, or delays in rendering/scrolling.
We’d already identified the major offenders — the Application and Activity onCreate — through our sub-spans. The traces helped shed light on what exactly was taking so long to execute.

We grouped these performance bottlenecks into three categories:
Waiting for dependencies to initialize
Serial loading and blocking operations
Main thread utilization
Our goal was to defer long-running operations and initialization of dependencies into the background workers to free up the main thread to handle user input, animations, and layout changes. Optimizing execution on these background workers would also speed up any rendering that relied on whatever was being executed. And all these improvements would inevitably help the UI and app startup feel more responsive.
With these insights in hand, we began making incremental improvements.
Putting our insights to work
Caching experiment configuration
We began by addressing usage of our experiment configuration library during the Application’s onCreate function. This library, which controls which features and experiences are enabled, required third-party dependencies to resolve and the latest experiment configuration to load before it was usable. Since the experiments were often used during startup (e.g., the Home Tab during development), we couldn’t just defer the initialization.
To improve performance, we introduced a fast-caching layer using a simple key-value store. We determined that it wasn’t always necessary to have the most up-to-date experiment configuration handy as long as it was relatively consistent between app launches and any experiment exposures were handled correctly. In a worker thread, the key-value store could be updated with the latest configuration and then used during the next startup.
Isolating slow code with a caching layer would become a recurring theme as we began making other performance optimizations.
Buffering analytics and logging
Analytics events and logging are crucial in making product decisions and debugging user issues — app startup performance being just one such example. The original implementation of our analytics and logging utilities required the initialization of a number of dependencies to mange events and log messages. It wasn’t essential to process these events and messages during application startup, though, so that could be deferred until startup was complete.
We introduced a lightweight buffering layer for events and logs to reduce the overhead of loading the analytics and logging libraries during startup. Once the critical parts of the app startup were finished, processors could begin dequeuing from the buffers and flushing data to the network. Until then, buffered data would also be persisted to disk to improve reliability in the event of app instability.
Caching the user session
The Home Tab's slow loading was mostly due to a dependency on the user session when deriving the tab's contents. The user session provides the rest of the application with information about logged-in accounts, available workspaces, and the currently active workspace, so loading the user session was a crucial step in rendering anything in the application.
In the traces, we learned that loading the user session required hydrating many records from the local database, which required synchronously initializing all the infrastructure for managing records, syncing new and updated values to/from the network, and establishing subscriptions for real-time changes. For the user, this process would appear as a shimmering placeholder until the user session and then the Home Tab contents had loaded.
What we realized was that that the current user and workspace were relatively stable between app opens, so instead of waiting for all dependencies to initialize the full user session, the Home Tab contents could start loading earlier by using a cached copy of the user and workspace data.
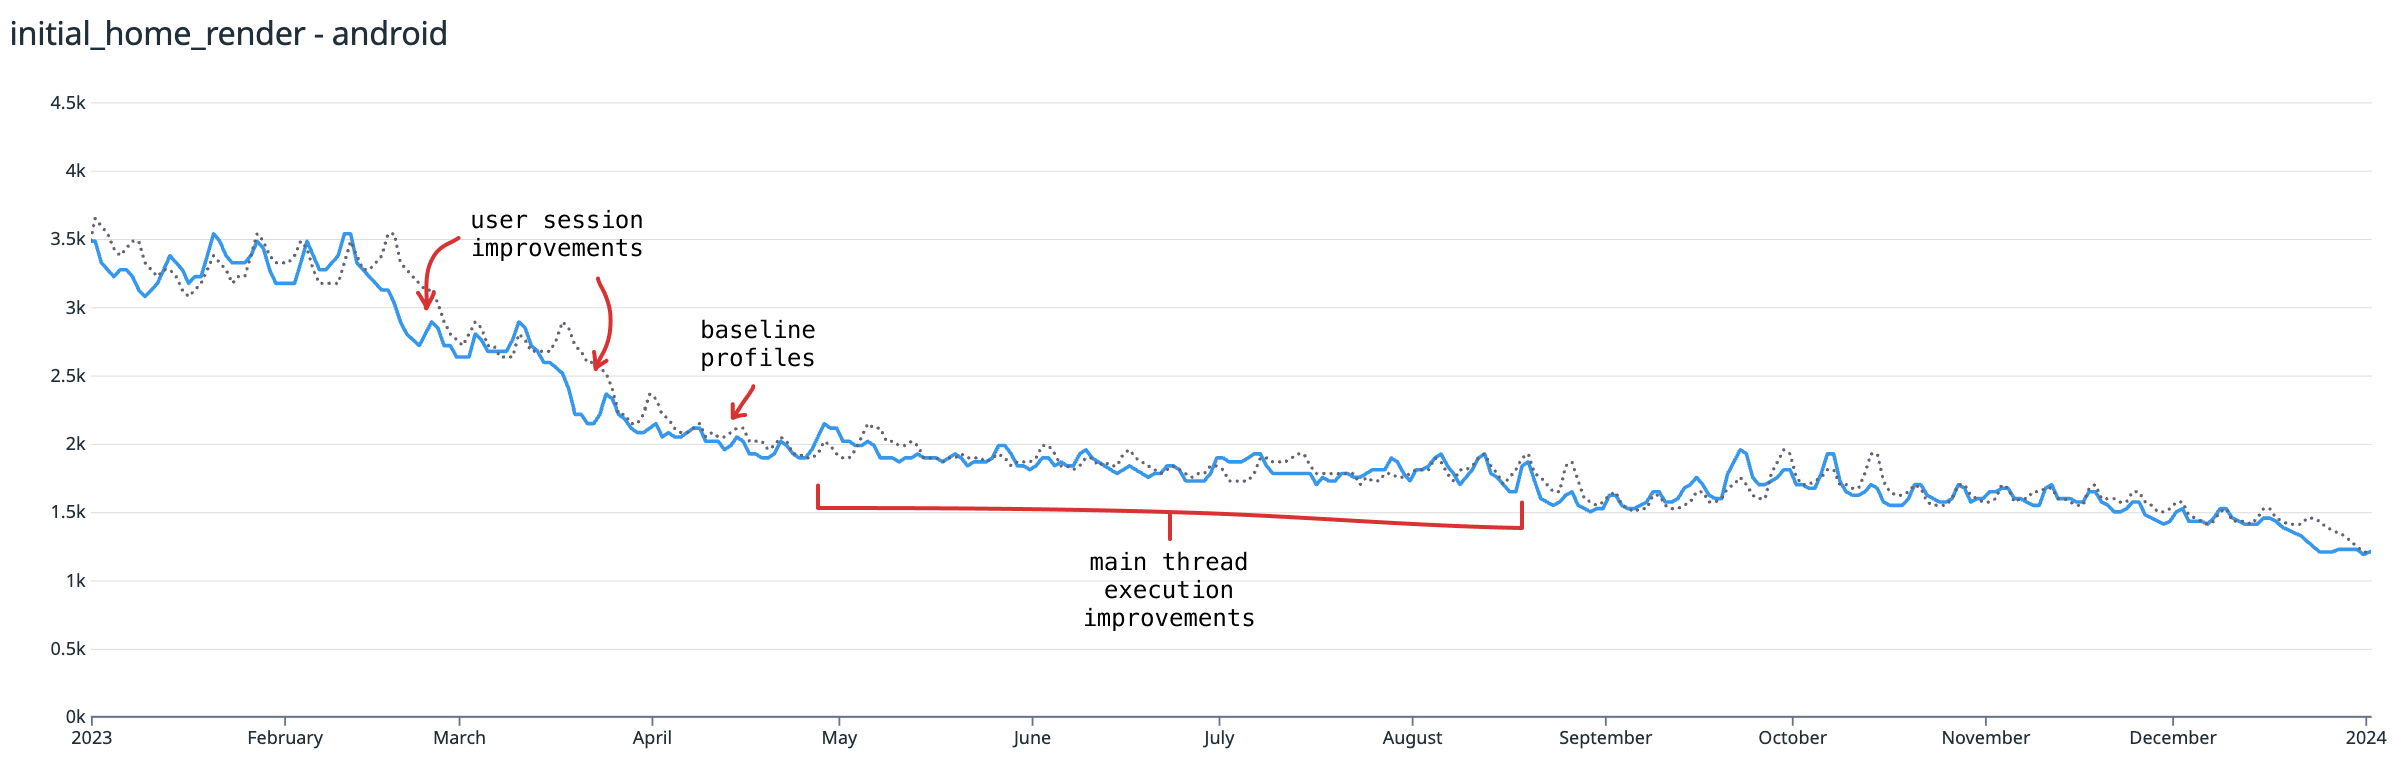
This change alone contributed to a ~30 percent improvement in the initial_home_render metric.

Checking for migrations before initializing SQLite
Notion mobile apps use SQLite to store the Block data that’s required in order to load Home Tab contents, Search Tab results, and enable the web app to render pages.
Occasionally, as the table schemas changed, migrations would be run to update them. These schema migrations are packaged as a single large JSON file, which was loaded and parsed on each startup. This JSON file also contained the schema migration version, which would be compared to the active database version to decide whether or not a migration was needed.
Through the traces, we found that the parsing of the migration JSON file was one of the wide spans that was slow and running on the main thread.

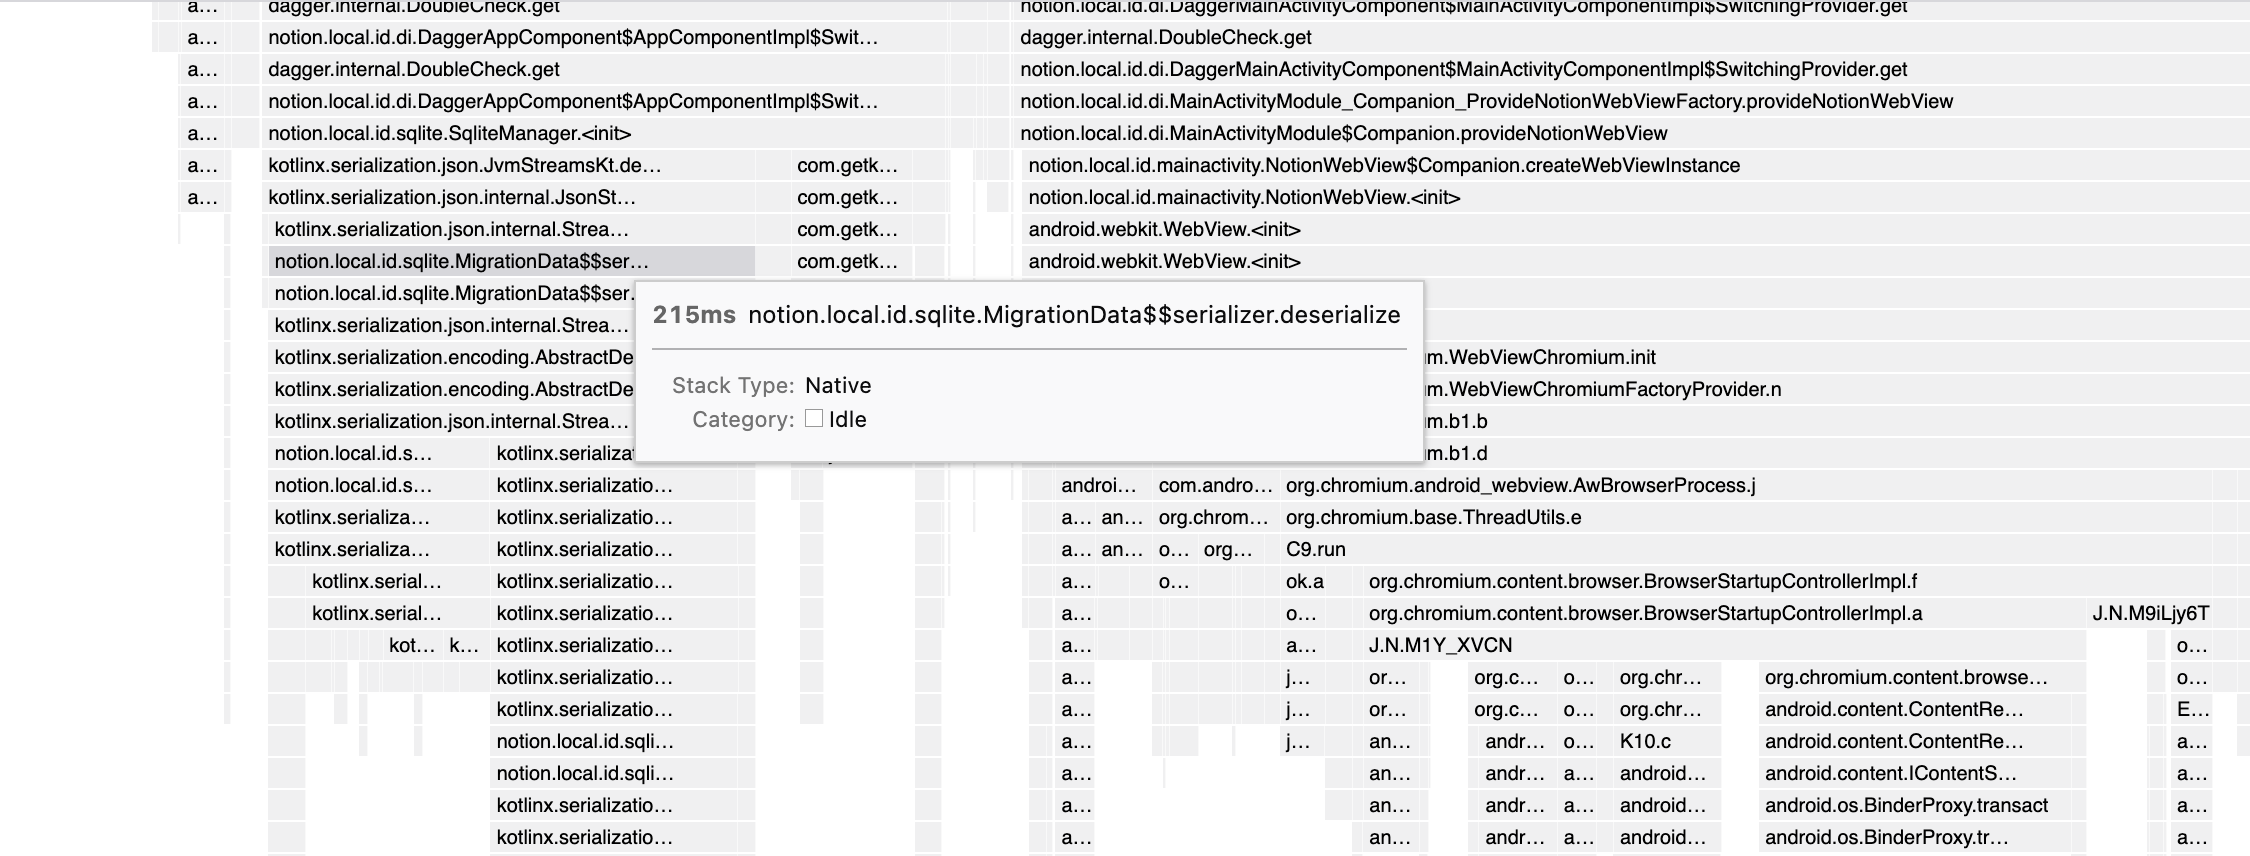
To eliminate the need to load the entire JSON file, we instead provided the migration version separately as an integer to allow the active and new migration versions to be compared much faster. In the the rare event that a migration was required, the complete JSON file could be loaded as normal to complete the migration.
Moving JSON serialization to a worker thread
We use Message Ports, an IPC channel provided by the WebView, for communication between the web app and native layer. Messages sent and received through Message Ports are JSON strings of varying sizes that are deserialized and serialized by the Native Layer. Traces we captured during profiling revealed that in certain cases — often during app startup — large JSON blobs were being deserialized on the main thread as shared state was being synced between the layers. As in previous examples, we were able to fix this by introducing buffers and parallelization to allow serialization/deserialization to be moved exclusively to a background thread.
With each release, app startup improved slightly. Between versions we’d measure the impact of each change and invest further where needed. By the end of the year, these and other smaller changes had resulted in ~45 percent speedup in P95 Initial Home Render.

Baseline profiles
A large portion of the Notion app, including the Home Tab, is built with Jetpack Compose. We added support for Baseline Profiles as soon as they were available, since app startup was often slower than expected, even in release builds. The promise of baseline profiles addressing Compose initialization and rendering performance during app startup performance was very exciting.
We generated Baseline Profiles for the Notion Android App by defining an app startup journey via the UIAutomator in a JUnit test. This test would launch the app, wait for the Home Tab to render, then scroll and expand various sections and pages in a test Workspace. After each successful run, the test runner would emit a generated baseline-prof.txt file which could be packaged with the release builds.
The included Baseline Profiles could then be used by the Android Runtime to perform ahead-of-time compilation and lead to faster code execution and improved application startup and frame render performance. When we first implemented these profiles, we measured P95 improvements of ~12 percent on our Initial Home Render metric.
Once we had established that the profiles were effective, we operationalized the process of generating them. Each release build process would first run the Baseline Profile generation process on real devices running in the Firebase Device Lab, then include them in the generated release APK/AAB. As we made improvements to the app startup and restructured code, older profile definitions would automatically be replaced by newer ones.
Measuring improvements
We were careful to measure improvements between app releases. Whenever a pull-request was merged, we ran automated Macrobenchmark tests to gauge startup performance using the same user journey with which we’d generated the Baseline Profiles. In addition to the standard measurements captured and reported by these Macrobenchmark tests, we used Trace markers and TraceMetrics to surface custom metrics for the various sub-spans we had introduced.
Then, after each test run, we published the metrics for initial_home_render and its sub-spans to our observability platform to be viewed as time series graphs, and reviewed weekly reports as new releases rolled out to track improvements and identify regressions before they became widespread.
The path forward
The improvements we made through profiling, introducing Baseline Profiles, and various smaller optimizations had a dramatic result: app startup is now twice as fast as it was at the start of 2023. Users should also see considerable improvements to scrolling performance in the Home and Search Tabs.
These optimizations are just a small part of our efforts to make using Notion a delightful experience. Today, Notion on Android should feel snappy to start up and faster to scroll than ever before. And the foundation we’ve built to monitor and benchmark startup gives us confidence that our users’ experience will keep improving in dramatic ways over time.
Excited about improving app performance and quality? Apply for our open roles here.

