We at ZingChart have been hard at work, creating a TypeScript Definition File and Angular component for our library!
ZingChart is one of the original JavaScript charting libraries, and continues to innovate and improve on its feature set. With over 35 different chart types, a rich API of methods/events to integrate with, and a dedicated support team, ZingChart provides an all-in-one solution for your data visualization needs.
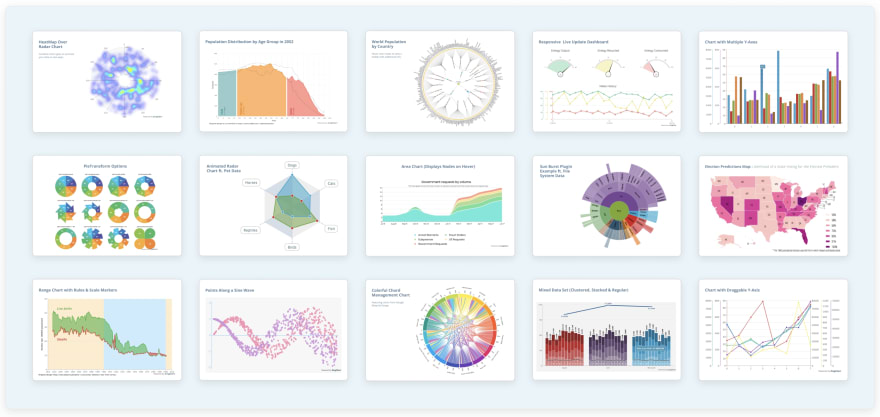
ZingChart has over 35 different base chart types and hundreds of configurations
For starters, we recently created a TypeScript definition file for the ZingChart library. All of the typings for our JSON configuration are now readily available, with descriptions for each attribute. This allows our developers who use TypeScript in their applications to validate their chart configurations with ease. This works well with IDEs such as Visual Studio Code that support type-ahead with descriptions. It is automatically included in our zingchart-angular component.

If you don’t have an Angular Application, you can easily set one up with the angular-cli
$ ng new my-app
First we add the package to our Angular Application via NPM:
$ npm i zingchart-angular
We then add our chart module to our App's module.
import { BrowserModule } from '@angular/platform-browser'; import { NgModule } from '@angular/core'; import { ZingchartAngularModule } from 'zingchart-angular'; import { AppComponent } from './app.component'; @NgModule({ declarations: [ AppComponent ], imports: [ BrowserModule, ZingchartAngularModule, ], bootstrap: [AppComponent] }) export class AppModule { }
Inside of the app.component.ts, we define the look and feel of our chart. We can use ZingChart's TypeScript Definition file to validate the JSON config:
import { Component } from '@angular/core'; @Component({ selector: 'app-root', templateUrl: './app.component.html', styleUrls: ['./app.component.css'] }) export class AppComponent { title = 'zing-app'; config:zingchart.graphset = { type: 'line', series: [{ values: [3,4,5,5,6,7,5,3] }] }; }
Finally, we add our a chart into our markup inside of app.component.html.
<div> <zingchart-angular [config]="config" [height]="500"></zingchart-angular> </div>