When you're connected to Splunk, click near the Administrator menu.
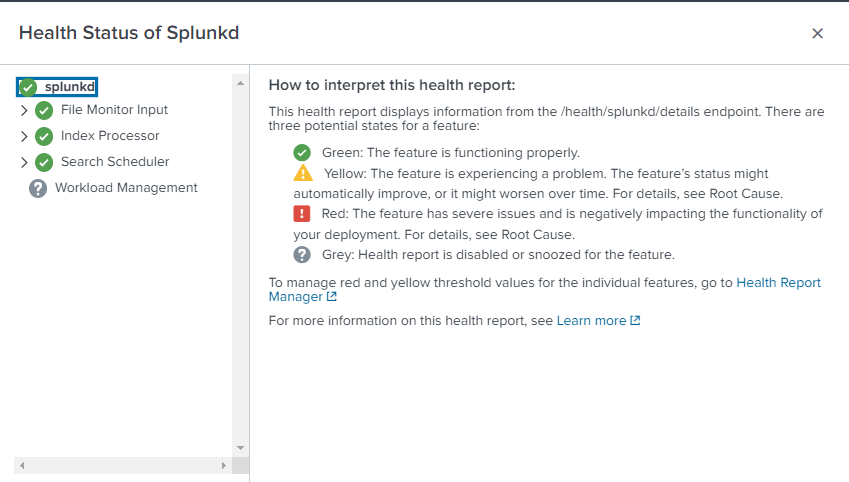
On the left control panel, you have the status of each part of Splunk Server. On the right control panel, you have the description of each signal.