Console Methods:
- Most basic form of debugging
- e.g.
-
console.log- normal logging, -
console.info- similar toconsole.log, -
console.error- used for throwing/ handling errors (changes look of logs in console + gives a stacktrace), -
console.warn- similar toconsole.errorbut used for warnings(only UI difference than previous) -
console.table- useful to use when we have data in array of objects where the objects have same keys, it formats it in a nice table// For this data, you get below output in console: const people = [ { name: "Wes", cool: true, country: "Canada" }, { name: "Scott", cool: true, country: "Merica" }, { name: "Snickers", cool: false, country: "Dog Country" } ]; people.forEach((person, index) => { console.table(person.name); });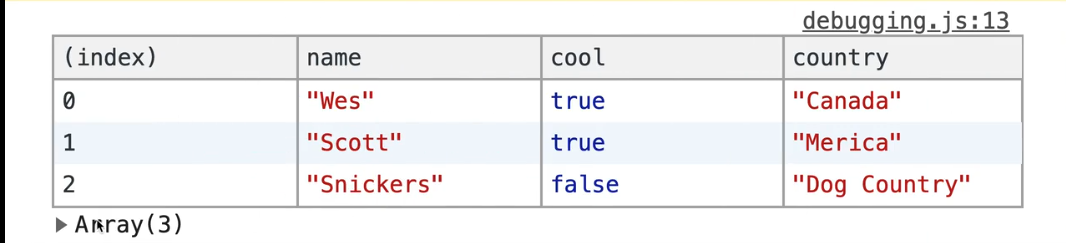
-
console.count- counts how many times, say, a function is runfunction doctorize(name) { console.count(`Running doctorize for ${name}`); return `Dr. ${name}`; } // console : > doctorize('wes') Running doctorize for wes: 1 < Dr. wes > doctorize('wes') Running doctorize for wes: 2 < Dr. wes > doctorize('snickers') Running doctorize for snickers: 1 < Dr. wes > doctorize('wes') Running doctorize for wes: 3 < Dr. wesuseful when we want to check why a function is running more times like hover element method triggering too many times.
The counting is based on what string we pass to
console.count. -
console.group- Group logs in a collapsible groupfunction doALotOfStuff() { console.group('Doing some stuff'); console.log('Hey Im one'); console.warn('watch out!'); console.error('hey'); console.groupEnd('Doing some stuff'); } doALotOfStuff();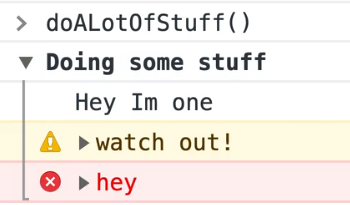
When we use
console.groupCollapsed('Doing some stuff');instead ofconsole.group('Doing some stuff');, then we get the collapsed look by default.
-
- Call Stack or Stack Trace: Tells us what function called what function called what function and so on..
Example:
function doctorize(name) {
  // console.count(`running Doctorize for ${name}`);
  return `Dr. ${name}`;
}

function greet(name) {
  doesntExist(); // Cause an error
  return `Hello ${name}`;
}

function go() {
  const name = doctorize(greet('Wes'));
  console.log(name);
}
In this above example, doesntExist function doesn't exist, which will cause an error, when we run the go function:
go()
Error:
debugging.js:32 Uncaught ReferenceError: doesntExist is not defined
    at greet (debugging.js:32)
    at go (debugging.js:37)
    at <anonymous>:1:1
The error says that this error occurred at line 32 in function greet. greet was called by go at line 37. The anonymous 1:1 comes as we ran it from our console, else it would have shown the line no. from where we would have called the go function in code.
- Grabbing Elements
If we select something using the Elements tab in dev tools, and then flip over to Console tab, then we run $0, then we get returned that selected item.
$0: the selected element
$1 : the last selected element
$2 : the second last selected element
and so on...
We also have $ and $$ in the console. We can't use them in code.
They are shorthand selectors.
-
They help us to select things based on selectors
e.g.
$('p')=document.querySelector('p'): selects first element that matches$$('p')=document.querySelectorAll('p'): selects all elements that match
- Breakpoints:
To pause JavaScript from running at a certain line of code, we write debugger;. The pausing of JavaScript only works when the DevTools is open. It helps us to peer into JavaScript at that very moment.
It shows us the call stack, values of local variables at that time and other useful stuff.
There are 2 buttons:
play/pause: clicking this runs JS till the next time debugger; is encountered in code.
step over next function call: runs the code line by line.
We can also set breakpoints from the browser by ourselves in the sources tab. This does the same thing as a debugger; i.e. stops the JS from running at that point.
- Network Requests:
To see the network requests, go to the Network tab in Devtools.
- Break on Attribute:
We can select an element in Elements tab and right click on it to select break on > attribute modifications. It means, when somebody changes its attributes, then there will be a breakpoint.
- Other types of breakpoints:
In Sources tab, there are other type of breakpoints too like mouse click, keyboard events, XHR or fetch breakpoints(breakpoint when a XHR request is made) etc.