
I’m a big fan of Prometheus and Grafana. As a former SRE at Google I’ve learned to appreciate good monitoring, and this combination has been a winner for me over the past year. I’m using them for monitoring my personal servers (both black-box and white-box monitoring), for the Euskal Encounter external and internal event infra, for work I do professionally for clients, and more. Prometheus makes it very easy to write custom exporters to monitor your own data, and there’s a good chance you’ll find an exporter that already works for you out of the box. For example, we use sql_exporter to make a pretty dashboard of attendee metrics for the Encounter events.
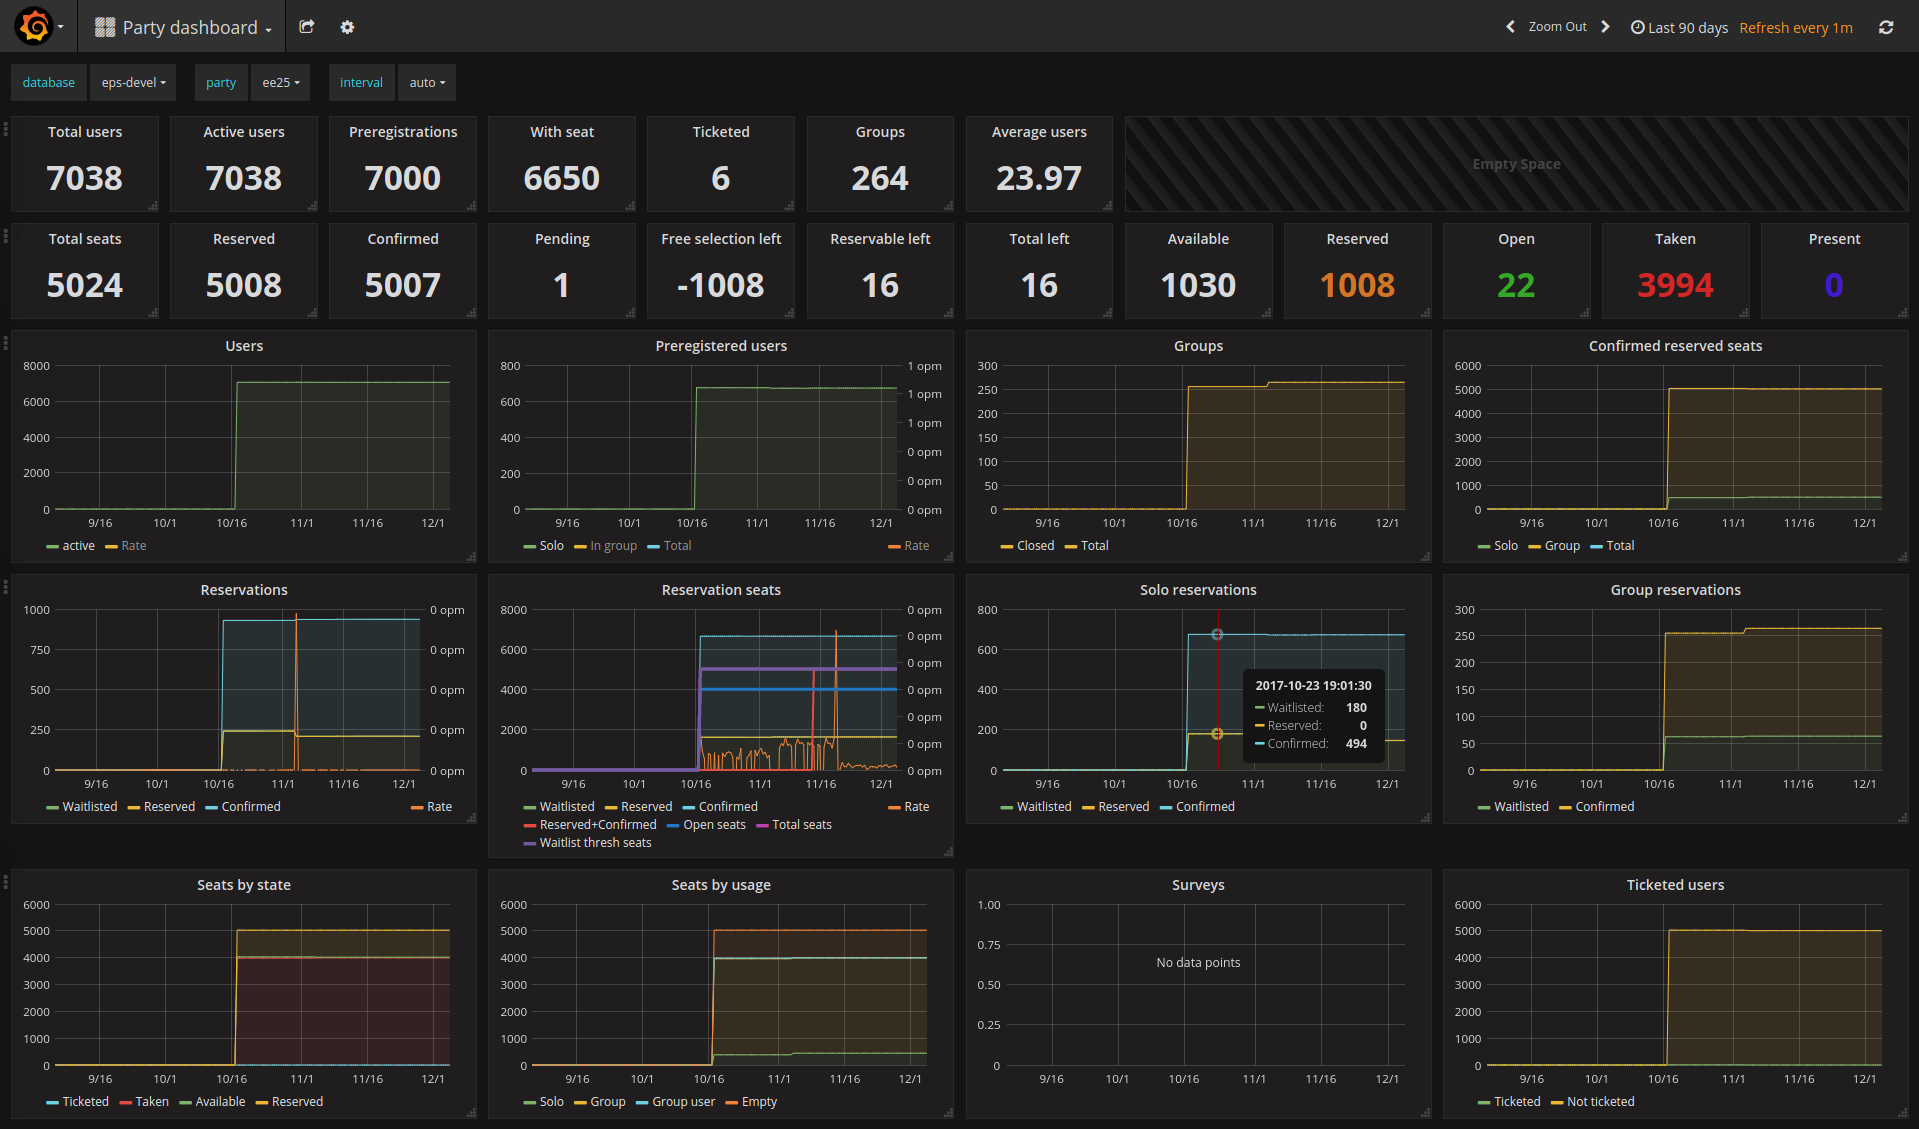
Event dashboard for Euskal Encounter (fake staging data)
Since it’s so easy to throw node_exporter onto any random machine and have a Prometheus instance scrape it for basic system-level metrics (CPU, memory, network, disk, filesystem usage, etc), I figured, why not also monitor my laptop? I have a Clevo “gaming” laptop that serves as my primary workstation, mostly pretending to be a desktop at home but also traveling with me to big events like the Chaos Communication Congress. Since I already have a VPN between it and one of my servers where I run Prometheus, I can just emerge prometheus-node_exporter, bring up the service, and point my Prometheus instance at it. This automatically configures alerts for it, which means my phone will make a loud noise whenever I open way too many Chrome tabs and run out of my 32GB of RAM. Perfect.
Barely an hour after setting this up, though, my phone did get a page: my newly-added target was inaccessible. Alas, I could SSH into the laptop fine, so it was definitely up, but node_exporter had crashed.
fatal error: unexpected signal during runtime execution
[signal SIGSEGV: segmentation violation code=0x1 addr=0xc41ffc7fff pc=0x41439e]

goroutine 2395 [running]:
runtime.throw(0xae6fb8, 0x2a)
        /usr/lib64/go/src/runtime/panic.go:605 +0x95 fp=0xc4203e8be8 sp=0xc4203e8bc8 pc=0x42c815
runtime.sigpanic()
        /usr/lib64/go/src/runtime/signal_unix.go:351 +0x2b8 fp=0xc4203e8c38 sp=0xc4203e8be8 pc=0x443318
runtime.heapBitsSetType(0xc4204b6fc0, 0x30, 0x30, 0xc420304058)
        /usr/lib64/go/src/runtime/mbitmap.go:1224 +0x26e fp=0xc4203e8c90 sp=0xc4203e8c38 pc=0x41439e
runtime.mallocgc(0x30, 0xc420304058, 0x1, 0x1)
        /usr/lib64/go/src/runtime/malloc.go:741 +0x546 fp=0xc4203e8d38 sp=0xc4203e8c90 pc=0x411876
runtime.newobject(0xa717e0, 0xc42032f430)
        /usr/lib64/go/src/runtime/malloc.go:840 +0x38 fp=0xc4203e8d68 sp=0xc4203e8d38 pc=0x411d68
github.com/prometheus/node_exporter/vendor/github.com/prometheus/client_golang/prometheus.NewConstMetric(0xc42018e460, 0x2, 0x3ff0000000000000, 0xc42032f430, 0x1, 0x1, 0x10, 0x9f9dc0, 0x8a0601, 0xc42032f430)
        /var/tmp/portage/net-analyzer/prometheus-node_exporter-0.15.0/work/prometheus-node_exporter-0.15.0/src/github.com/prometheus/node_exporter/vendor/github.com/prometheus/client_golang/prometheus/value.go:165 +0xd0 fp=0xc4203e8dd0 sp=0xc4203e8d68 pc=0x77a980
node_exporter, like many Prometheus components, is written in Go. Go is a relatively safe language: while it allows you to shoot yourself in the foot if you so wish, and it doesn’t have nearly as strong safety guarantees as, say, Rust does, it is still not too easy to accidentally cause a segfault in Go. More so, node_exporter is a relatively simple Go app with mostly pure-Go dependencies. Therefore, this was an interesting crash to get. Especially since the crash was inside mallocgc, which should never crash under normal circumstances.
Things got more interesting after I restarted it a few times:
2017/11/07 06:32:49 http: panic serving 172.20.0.1:38504: runtime error: growslice: cap out of range
goroutine 41 [running]:
net/http.(*conn).serve.func1(0xc4201cdd60)
        /usr/lib64/go/src/net/http/server.go:1697 +0xd0
panic(0xa24f20, 0xb41190)
        /usr/lib64/go/src/runtime/panic.go:491 +0x283
fmt.(*buffer).WriteString(...)
        /usr/lib64/go/src/fmt/print.go:82
fmt.(*fmt).padString(0xc42053a040, 0xc4204e6800, 0xc4204e6850)
        /usr/lib64/go/src/fmt/format.go:110 +0x110
fmt.(*fmt).fmt_s(0xc42053a040, 0xc4204e6800, 0xc4204e6850)
        /usr/lib64/go/src/fmt/format.go:328 +0x61
fmt.(*pp).fmtString(0xc42053a000, 0xc4204e6800, 0xc4204e6850, 0xc400000073)
        /usr/lib64/go/src/fmt/print.go:433 +0x197
fmt.(*pp).printArg(0xc42053a000, 0x9f4700, 0xc42041c290, 0x73)
        /usr/lib64/go/src/fmt/print.go:664 +0x7b5
fmt.(*pp).doPrintf(0xc42053a000, 0xae7c2d, 0x2c, 0xc420475670, 0x2, 0x2)
        /usr/lib64/go/src/fmt/print.go:996 +0x15a
fmt.Sprintf(0xae7c2d, 0x2c, 0xc420475670, 0x2, 0x2, 0x10, 0x9f4700)
        /usr/lib64/go/src/fmt/print.go:196 +0x66
fmt.Errorf(0xae7c2d, 0x2c, 0xc420475670, 0x2, 0x2, 0xc420410301, 0xc420410300)
        /usr/lib64/go/src/fmt/print.go:205 +0x5a
Well that’s interesting. A crash in Sprintf this time. What?
runtime: pointer 0xc4203e2fb0 to unallocated span idx=0x1f1 span.base()=0xc4203dc000 span.limit=0xc4203e6000 span.state=3
runtime: found in object at *(0xc420382a80+0x80)
object=0xc420382a80 k=0x62101c1 s.base()=0xc420382000 s.limit=0xc420383f80 s.spanclass=42 s.elemsize=384 s.state=_MSpanInUse
 <snip>
fatal error: found bad pointer in Go heap (incorrect use of unsafe or cgo?)

runtime stack:
runtime.throw(0xaee4fe, 0x3e)
        /usr/lib64/go/src/runtime/panic.go:605 +0x95 fp=0x7f0f19ffab90 sp=0x7f0f19ffab70 pc=0x42c815
runtime.heapBitsForObject(0xc4203e2fb0, 0xc420382a80, 0x80, 0xc41ffd8a33, 0xc400000000, 0x7f0f400ac560, 0xc420031260, 0x11)
        /usr/lib64/go/src/runtime/mbitmap.go:425 +0x489 fp=0x7f0f19ffabe8 sp=0x7f0f19ffab90 pc=0x4137c9
runtime.scanobject(0xc420382a80, 0xc420031260)
        /usr/lib64/go/src/runtime/mgcmark.go:1187 +0x25d fp=0x7f0f19ffac90 sp=0x7f0f19ffabe8 pc=0x41ebed
runtime.gcDrain(0xc420031260, 0x5)
        /usr/lib64/go/src/runtime/mgcmark.go:943 +0x1ea fp=0x7f0f19fface0 sp=0x7f0f19ffac90 pc=0x41e42a
runtime.gcBgMarkWorker.func2()
        /usr/lib64/go/src/runtime/mgc.go:1773 +0x80 fp=0x7f0f19ffad20 sp=0x7f0f19fface0 pc=0x4580b0
runtime.systemstack(0xc420436ab8)
        /usr/lib64/go/src/runtime/asm_amd64.s:344 +0x79 fp=0x7f0f19ffad28 sp=0x7f0f19ffad20 pc=0x45a469
runtime.mstart()
        /usr/lib64/go/src/runtime/proc.go:1125 fp=0x7f0f19ffad30 sp=0x7f0f19ffad28 pc=0x430fe0
And now the garbage collector stumbled upon a problem. Yet a different crash.
At this point, there are two natural conclusions: either I have a severe hardware issue, or there is a wild memory corruption bug in the binary. I initially considered the former unlikely, as this machine has a very heavily mixed workload and no signs of instability that can be traced back to hardware (I have my fair share of crashing software, but it’s never random). Since Go binaries like node_exporter are statically linked and do not depend on any other libraries, I can download the official release binary and try that, which would eliminate most of the rest of my system as a variable. Yet, when I did so, I still got a crash.
unexpected fault address 0x0
fatal error: fault
[signal SIGSEGV: segmentation violation code=0x80 addr=0x0 pc=0x76b998]

goroutine 13 [running]:
runtime.throw(0xabfb11, 0x5)
        /usr/local/go/src/runtime/panic.go:605 +0x95 fp=0xc420060c40 sp=0xc420060c20 pc=0x42c725
runtime.sigpanic()
        /usr/local/go/src/runtime/signal_unix.go:374 +0x227 fp=0xc420060c90 sp=0xc420060c40 pc=0x443197
github.com/prometheus/node_exporter/vendor/github.com/prometheus/client_model/go.(*LabelPair).GetName(...)
        /go/src/github.com/prometheus/node_exporter/vendor/github.com/prometheus/client_model/go/metrics.pb.go:85
github.com/prometheus/node_exporter/vendor/github.com/prometheus/client_golang/prometheus.(*Desc).String(0xc4203ae010, 0xaea9d0, 0xc42045c000)
        /go/src/github.com/prometheus/node_exporter/vendor/github.com/prometheus/client_golang/prometheus/desc.go:179 +0xc8 fp=0xc420060dc8 sp=0xc420060c90 pc=0x76b998
Yet another completely different crash. At this point there was a decent chance that there was truly an upstream problem with node_exporter or one of its dependencies, so I filed an issue on GitHub. Perhaps the developers had seen this before? It’s worth bringing this kind of issue to their attention and seeing if they have any ideas.
Unsurprisingly, upstream’s first guess was that it was a hardware issue. This isn’t unreasonable: after all, I’m only hitting the problem on one specific machine. All my other machines are happily running node_exporter. While I had no other evidence of hardware-linked instability on this host, I also had no other explanation as to what was so particular about this machine that would make node_exporter crash. A Memtest86+ run never hurt anyone, so I gave it a go.
And then this happened: